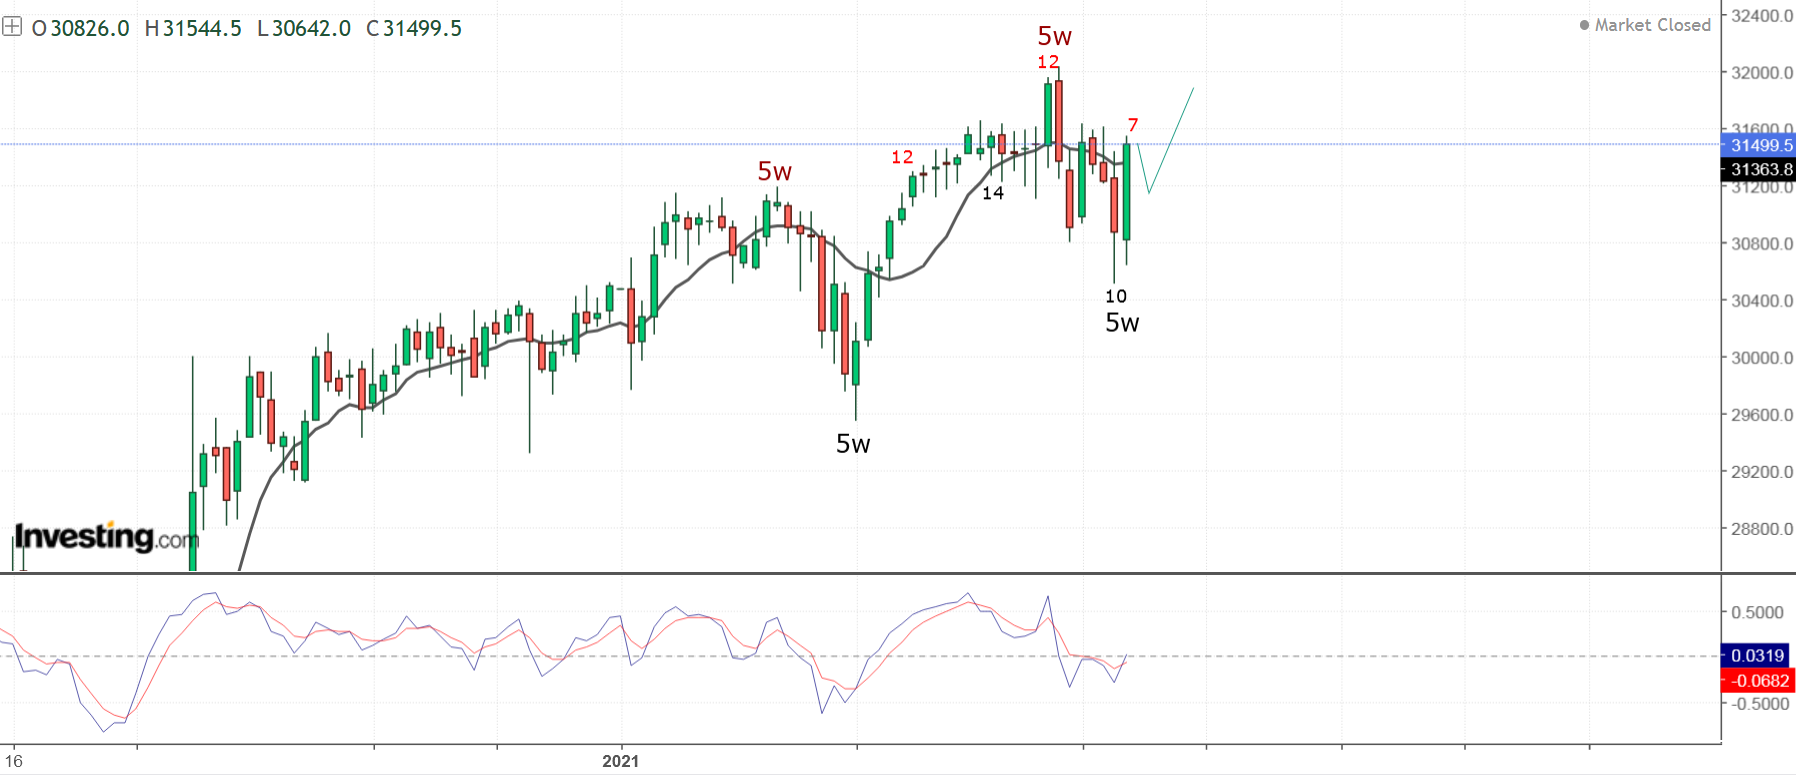
FOMC was a high, it is too early to say for sure if this was the HIGH there is no significant technical damages. From pattern perspective there is possible completed pattern, but sharp reversal is missing so far. From cycle perspective I see right translated 20d cycle this means the next one should make higher high before reversing.
I am starting to like the idea with one more 5w cycle high, but I will wait too see what happens next week it should give as more clarity.
Many questions and suggestion what if something else is going on. So this is the subject this week:)
Short term - the pattern is very difficult you can not pin point it for sure, cycles the 18m high could be extended with one more 5w cycle something like mid-April, but that is all. Watch next week closely for an answer:
- if we saw the high this week, next week should open with gap lower and move fast 60-80-100 points day even two such days.
- if the high is next week Friday should be the b-wave and we should see the indices higher next week.
- if there is one more 5w cycle before the top next week should be lower, but moving slowly.
Long term - look at below the weekly chart this are my alternate scenarios. To summarize it - you should pray that Neely is right, because you will not like the "what if".
TRADING
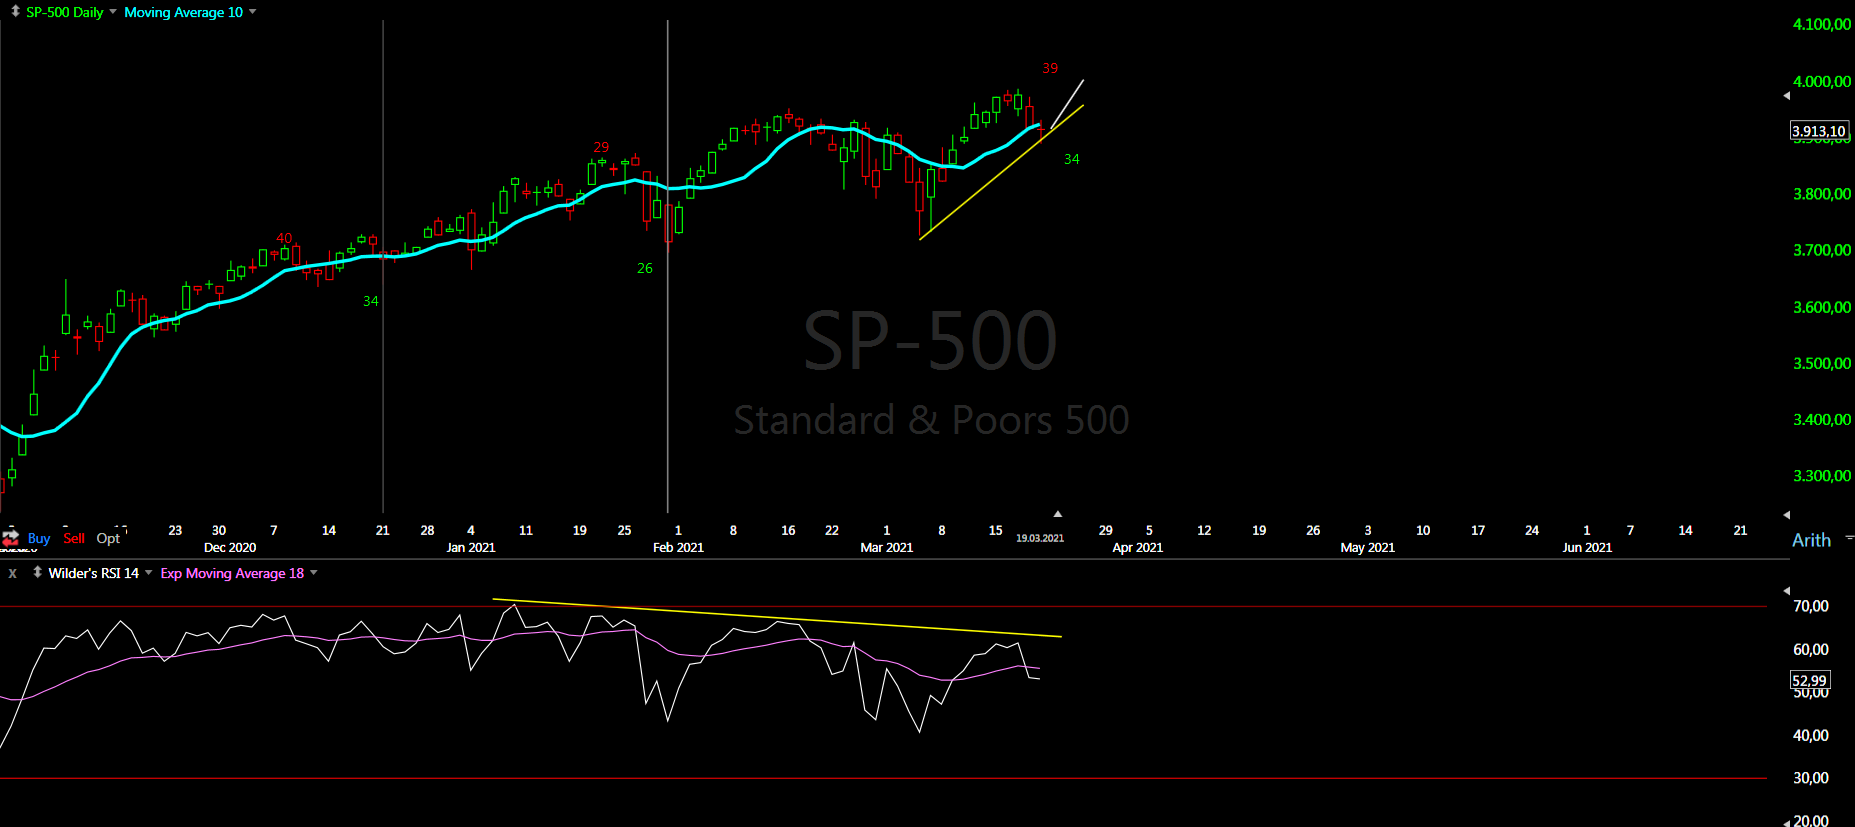
Trading cycle - buy signal. Again right translated 20d cycle finding support around MA10. We should see one more high before reversal. High-to-high daily cycle a few more days and it will reach the average length and this should be intermediate term high at least.
TECHNICAL PICTURE and ELLIOTT WAVES
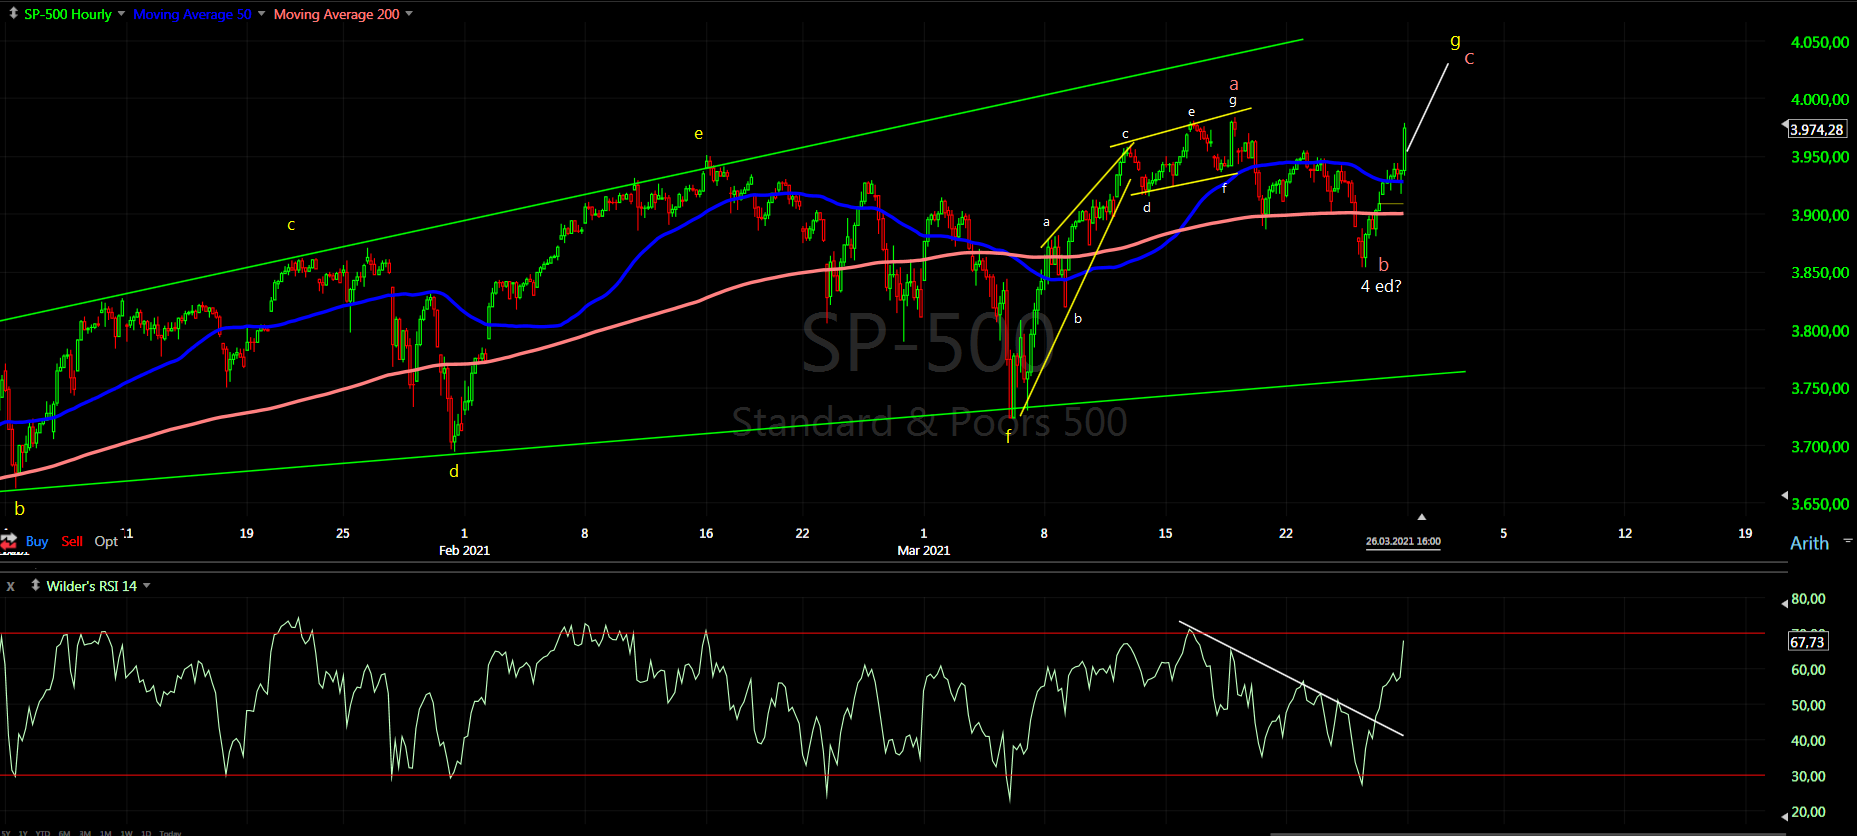
Short term - I see one diametric completed.... again if this is the top we should see sharp decline next week if not it is just wave a. Alternate with one more 5w high I have to shift the labels d-f to the right or count diagonal C-wave.
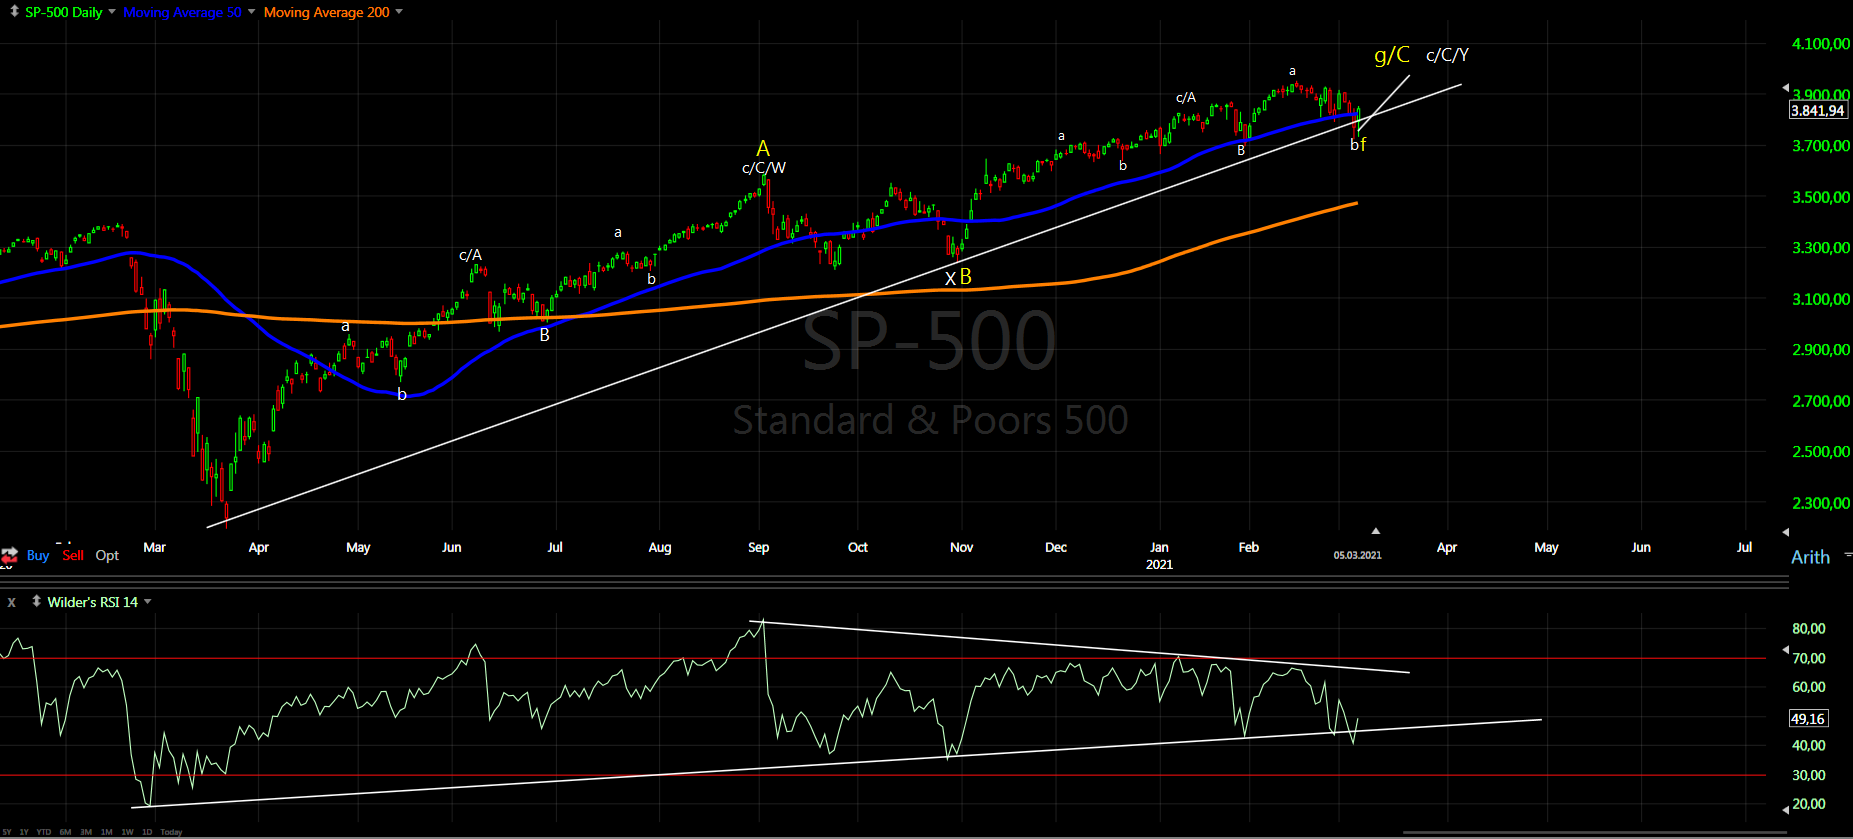
Intermediate term - I see one big zig-zag up. You can count it as W-X-Y(white) classic EW, but we do not have impulses. More likely series of zig-zags A-B-C(yellow) with the C-wave as a diametric.
Besides market breadth and indicator divergences, almost every index shows similar pattern from the November low - complex structure with many zig-zags. That is why I can see extension for 2-3 weeks, but another 2-3 months is fantasy for me.

Long term - what if something else is going on? NYSE chart below for a clear pattern without tech stocks distortion.
- First option the main stream got it right(I would not believe this even if I see it:) - we have impulse and this is the fifth wave. So with clear corrective leg this is w1 of ED. Than we need waves 2-3-4-5 and sometimes next year it is completed with 4y cycle high. This is the high for mega wave (III) from the low in 1929 and huge sideways wave (IV) begins. Usually it retraces to the low of the previous wave4 of lower degree (the 2009 low) and it will take decades.
Personal opinion - it is more than clear from 2009 this is not an impulse. It is the same crappy corrective structure as the current move from the March.2020 low. Please do not try to explain me - no it is not an impulse.
- Second option Neely is both right and wrong - right because the correction began in 2000 and it is a triangle, but wrong because it is not neutral triangle. In neutral triangle the C-wave should be the longest and the most complex wave and it is not. He tries to make it fit and counts the C-wave bottom in 2010. In this case the triangle is expanding triangle from 2000 with complex D-wave diametric.
Depending on where you count the previous 4y cycle high(Jan.2018 or Sept.2018) this could be top of the D-wave or one more zig-zag up next year. Then comes the E-wave and the 70%-90% decline, which Peter Eliades is talking about.
Neely's count is like a walk in the park compared to the alternative scenarios. Imagine what will happen in the real world if we have 20-30 years economical problems(first option) or 1929 style reset Great Depression v.2(second option).
I pray that Neely is right, but my mood gets darker with every day watching what happens around me..... and I feel something very nasty will happen.

Market Breadth Indicators - many with long term multiple divergences. The indices should be close to a top of higher degree.
McClellan Oscillator - below zero, one more high for divergence?
McClellan Summation Index - weak, multiple divergences.
Weekly Stochastic of the Summation Index - neutral.
Bullish Percentage - reached 70, multiple divergences.
Percent of Stocks above MA50 - reached 75, multiple divergences.
Fear Indicator VIX - one more test of the low and almost closed the gap.
Advance-Decline Issues - lower high, multiple divergences.
HURST CYCLES
Short term cycles - this week should be 20d low next we should see 20d high. Changed the weekly labels for the alternate scenario with one more 5w high.
Week 7 for the 20w cycle. What if something else:
- first I am trying to extend the 18m cycle - I would say one more 5w cycle is ok... even looking better. More extension makes zero sense.
- second I am trying to count the February low as 20w low and I can not. Between the September and February highs you have almost six months this means you have 20w+10w highs and this means somewhere between this two highs you MUST have 20w low and this is the January low not the February low.
This is the alternate model - the difference is one more 5w cycle for the 18m high.