Trading cycle - buy signal. More MA10 crosses... trusting the analysis and ignoring all this crosses from the last three months was the right choice. The next turn lower should not be ignored.

TECHNICAL PICTURE and ELLIOTT WAVES
Short term - it looks like b-wave zig-zag and final rally running... alternate 4 of ED.
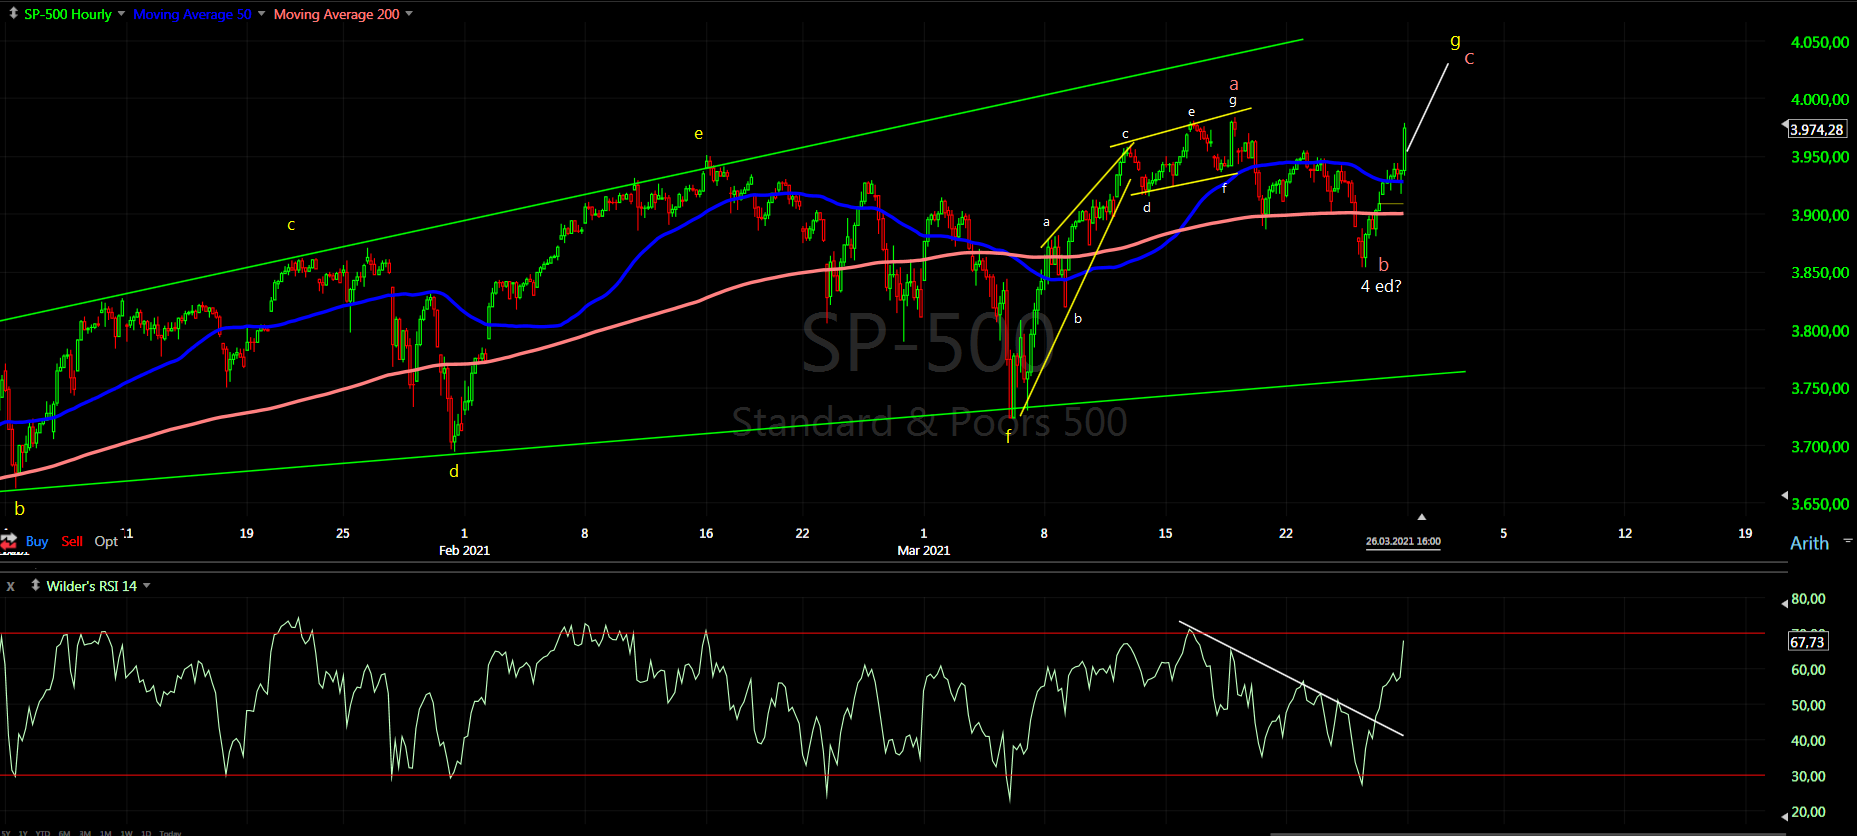
Intermediate term - I see one big zig-zag up. You can count it as W-X-Y(white) classic EW, but we do not have impulses. More likely series of zig-zags A-B-C(yellow) with the C-wave as a diametric. Plenty of divergences, just waiting to see how the final move up will play out.

Long term - waiting for another 1-2 weeks to complete the move from March 2020. Then expect 8-10 weeks lower and we will watch how big the decline will be.

MARKET BREADTH INDICATORS
Market Breadth Indicators - the same like last week, most of them with long term multiple divergences.... turning up for the final high.
McClellan Oscillator - turned up around zero, expecting to see lower high.
McClellan Summation Index - very weak sell signal.
Weekly Stochastic of the Summation Index - neutral.
Bullish Percentage - around 70, final short term divergence?
Percent of Stocks above MA50 - above 75, one more divergence?
Fear Indicator VIX - testing the low and the gap again.
Advance-Decline Issues - weak, testing the previous lows, expecting another lower high.
HURST CYCLES
Short term cycles - heading into 20d high next week. Hihg-to-high count I think this alternate count with 10w highs is better, just they are shorter with three 20d cycles.

Week 8 for the 20w cycle. The white labels are Hurst cycles shown last week. I am showing the chart because of the yellow labels. From March 2020 we have a big zig-zag consisting of two zig-zags and the yellow labels are showing the length of the single waves. You can see the waves have comparable length 11-9-10 weeks. The current and last fourth surge higher is already 8 weeks long so another 1-2 weeks. In two weeks the two zig-zags will have the same length 23 weeks and the size relation is 0,618.
What I want to say is the indices are close to a high.

Krasi what is your opinion on DXY ?
ReplyDeletePullback lower and higher for 2-3 months for 18 month high.
DeleteNo top until June. Go ahead and say that is absurd, you've been calling for a top for the last 3 months atleast. I'm expecting a drop until May then rally into June, then actual crash in Summer. It will be very quick in Summertime and last 1 month at most imo. VIX is the best to follow for pattern. We are in WXY correction. We are in Y part of correction.
ReplyDeleteGood luck!!
DeleteP.S.
"you've been calling for a top for the last 3 months atleast" - to justify your beliefs I am wrong and explaining this with false claims, which I have never made...
Making up stories will not make your analysis right - it is still wrong.
Krasi, can you give a target for the eur-usd for the 18 month low ? (18 month high in dxy)
ReplyDeleteProbably the 97-99 area.
DeleteKrasi thoughts on China Iran deal? And also the isual sell off in China stocks on Friday... all interesting timing...
ReplyDeleteI do not have any thoughts about that. I watch the charts that's it.
DeleteKrasi, have been following you from long now. what do you think could be the catalyst to trigger the downside. N does it have to be a sharp reversal? you think it starts this week or next week max? Thank you for all you do.
ReplyDeleteYes, it should be a steep decline and start this or next week.
DeleteThe catalyst should be a surprise, information which is known is already priced in. Often the markets just decline, because there is no more buyers.
Krasi, gold and crude have reversed already?, they go down first and then the indexes?
ReplyDeleteGold made a top long ago and it is heading into 18 month low - not there yet. If you mean it made a low and it will move reverse to them - I do not think so the USD should move higher and precious metals lower.
DeleteCrude oil has very high correlation with the indices in the last years and sometimes turns before them - yes it looks like it reversed already.
april comes in like a lion?
ReplyDeleteSo if this thing doesn't pull back in a few weeks does that mean we are in Wave 5?
ReplyDeleteThere is no impulse so there is no wave 5.
DeleteI changed my tune, I think we will top within the next couple of days. I think the entire month of April will be down, then bottom early May
ReplyDeleteThe cycles are clear no bottom until June.
DeleteTime to watch closely what happens next, we have possible top yesterday - https://ibb.co/JrYrwbj
ReplyDeleteWe have the minimum for a zig-zag and 20d high at day 10. Today should be a green day for continuation higher to avoid the bearish scenario.
Zig-zags and double zig-zags are everywhere and if you look at DJ the second double zig-zag for C should be completed with RSI divergence - https://ibb.co/HFXF7YH
More precise 10min chart - https://ibb.co/P6rpwMb
DeleteIf we have a top the indices should just move lower. If there is more up they should open higher and move higher. The a-wave was double zig-zag and if the c-wave is a double zig-zag too we should see another zig-zag up and converging Fibo measurements from three different degrees point to exactly the same area 4020-4025 (two are shown on the chart and the third one is the two legs from the early March low c=0,618xa - the red labels on the hourly chart)
Krasi, what about the dax
ReplyDeleteWhere do you see the top?
ReplyDeleteAnd the ndx 100?
ReplyDeleteAll indices will turn lower, NDX from a lower high.
DeleteThanks
ReplyDeleteKrasi, the nasdaq go up from 13300, don't you think it's go to the top again?
ReplyDelete4011, so 9 point left, very interesting
ReplyDeleteHi Kraci, you still think we get the bear market. I think we are at the very tope of the range. Should absolutely start crashing down next week. I have 4035 SPX line in sand on daily closing. M not sure the market makes more than just a little pullback from there looking at how vix is behaving. Doesnt seem like the top.
ReplyDeleteI don't see any top tbh, vix & vvix broken down, breadth has recovered, not many divergences, I think it is time to readjust
ReplyDeleteAlso, it is amazing how slope gets more vertical on each rally after FED intervenes, and bigger drops. I wonder what we'll get this time ;)
DeleteForgot to paste
Deletehttps://www.tradingview.com/x/5yaLjBZy/
I wonder if the next one is going to be solvency crisis stage ;-)
DeleteI also wonder if central bankers are petrified, all the actions look like desperation to me
DeleteWell oneside you are saying you dont see any top and then you are showing that chart where its showing all the way down to 2200 from this range?? really?
DeleteI meant we'll have to wait bit longer than Krasi's last comment, but when it does crash it'll be spectacular
DeleteMaybe instead of 1-2 weeks 3 weeks... not much left. Not to forget this pattern is very very difficult I do not expect to nail it, the same with cycles too much churning up and down.
DeleteI think we have to wait, Nasdaq go up to the top
ReplyDeleteWhat the reason to go down? Look at the vix
ReplyDeleteWhat reason not to go down look a the weekly chart divergences everywhere.
Delete