Trading cycle - sell signal. There is two options - sideways pattern is running or it finds resistance at MA10 and the decline continues next week for a few more weeks. I think it is the first option and if it is the second you can buy 20w low.

TECHNICAL PICTURE and ELLIOTT WAVES
Short term - looks like complicated overlapping correction. If you look at DJ/NYSE you will see simple zig-zag with c=a. Still expecting final zig-zag higher.

Intermediate term - I see one big zig-zag up. You can count it as W-X-Y(white) classic EW, but we do not have impulses. More likely series of zig-zags A-B-C(yellow) with the C-wave as a diametric.
Too deep retracement for zig-zag C/Y(white)... maybe a triangle?
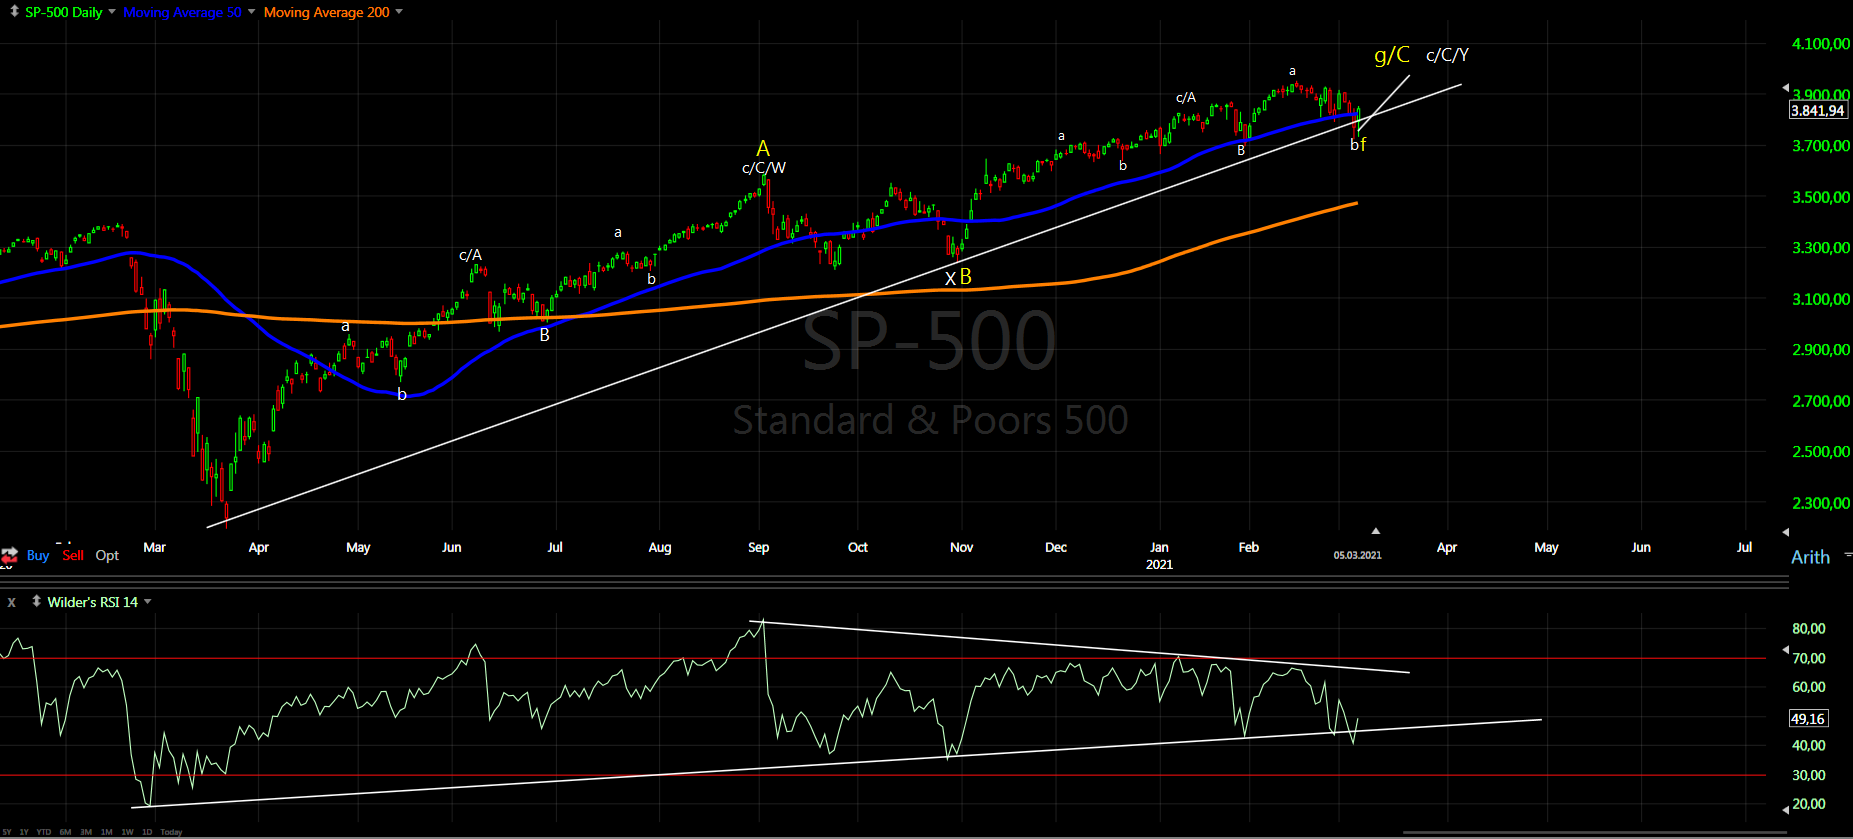
Long term - the bull market completed in 2018. Since then a bunch of corrective waves. Currently I think this rally should be a corrective wave of a bigger pattern most likely triangle. Look at NDX we have corrective wave which is 1,618 bigger than the previous one which could be only b of a triangle. I think the best looking pattern is Neely's triangle.
The best alternate pattern I see, if it is not a triangle, is w1 of ED and 50%-62% decline for w2 of the diagonal.

MARKET BREADTH INDICATORS
Market Breadth Indicators - lower after the weakness this week, but turning up hinting short term bottom.
McClellan Oscillator - turned up, but still below zero.
McClellan Summation Index - sell signal.
Weekly Stochastic of the Summation Index - sell signal.
Bullish Percentage - trying to turn up.
Percent of Stocks above MA50 - turned up.
Fear Indicator VIX - one more test of the low?
Advance-Decline Issues - small divergence and turning up.
HURST CYCLES
Short term cycles - I think it is better to look other indices like DJ - I expect several days higher for 20d high.
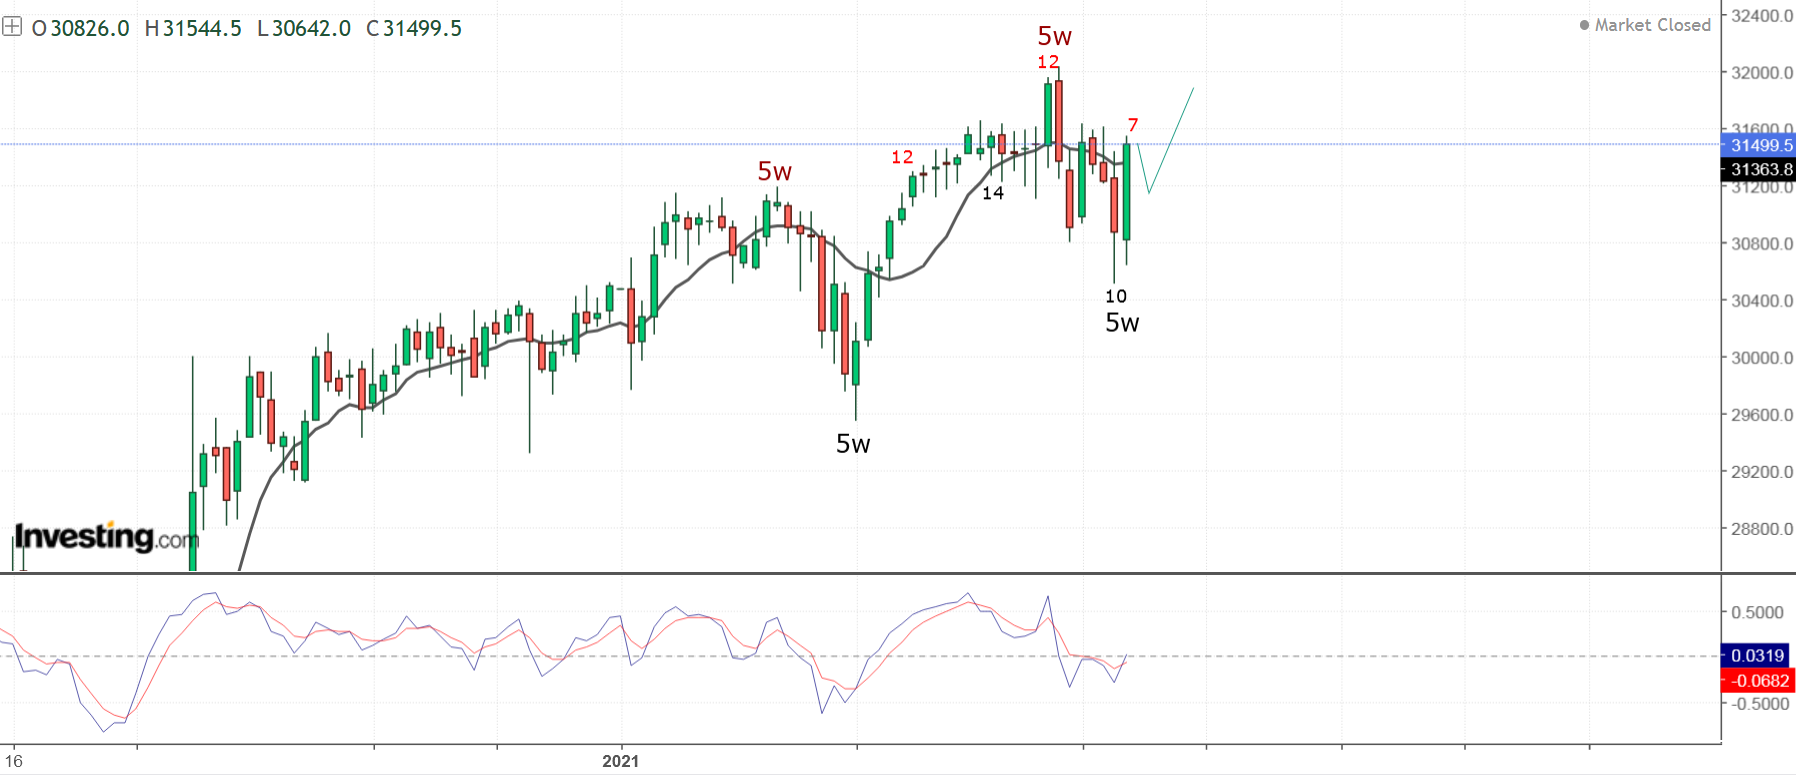
Week 5 for the 20 week cycle. NYSE the price action and this weekly candle has nothing to do with 20w low. I have marked all the 10w lows - it is not even a 10w low. If we see another 2-3 weeks lower than it will be 20 low. For all the guys with "another three months higher" - if we do not see several more weeks lower you can forget your three months higher.

This is what I see - you have one big zig-zag up, which consists of two smaller zig-zags. Time relationship is similar and currently the middle section of the second leg of the smaller zig-zag was completed - the green arrow two weeks correction and up. What is left is 2-3 weeks final zig-zag (the circle) to complete the whole structure from the March low. Another 2-3 months makes zero sense - out of proportions big time.

Krasi, how do you see the composite indonesia (idx) for short term view..tq..krasi
ReplyDeleteI can not give reliable prediction.
DeleteDice:
ReplyDelete"Long term - the bull market completed in 2018".
En mi modesta opinión desde 2018 a marzo de 2020 se puede haber hecho una corrección completa, un ABC en una extraña plana. Después de marzo de 2020 podríamos estar de nuevo en un periodo muy largo impulsivo al alza, en un mercado que vaya a subir mucho.
Alojo el gráfico de lo que comento en:
http://prntscr.com/10en21x
This is a totally wrong idea.
DeleteEn Cataluña (con Ñ) los impulsos tienen 7 ondas, y las correcciones se cuentan ABCJV.
ReplyDeleteSi us plau!!!
????
DeleteKrasi, when do you expect to see the top? 2-3 weeks or days?
ReplyDeleteweeks...
DeleteCan you comment on UVXY?
ReplyDeleteThank You
I have posted svxy chart a few weeks ago it is playing out so here it is updated - https://ibb.co/BZ97YPS
DeleteFinal leg up to complete zig-zag and the whole structure from the March low with 18 month cycle high. UVXY is the opposite.
Krasi, do you have a forecast for Nasdaq? It has declined more than other indices so curious to know.
ReplyDeleteEven if we saw the top it should do the same zig-zag higher to retrace before continuing lower.
DeleteAre you expecting the bigger decline shown on the long term chart in the next few weeks?
ReplyDeleteYes, according to the white chart around the middle of the fourth March week.
DeleteThanks! Might today be close to the top?
ReplyDeleteIMHO I would prefer to see one more high (lower or higher) as things would align nicely (other asset classes, breadth), VIX & VIX future & VXX last gaps to be closed but you never know, it may fall for no reason
ReplyDeleteDo you see APT or AHPI rallying when the market crashes? It looks like it's making a bottom the same time the market is topping.
ReplyDeleteI do not know why this shares APT/AHPI should be reverse correlated to the indices, but yes it looks like long sideways move and they can spike higher.
DeleteThank you. They went up with the covid fears last year. But now that covid is going away I dont know why they would go up other a fear trade.
DeleteThank you for your help. Are you expecting that the market will go down to 2300 in March or 3800?
ReplyDeleteI can not say how March will play out. Predicting tops usually does not work.
DeleteThank you. I was trying to understand if we were at the point of a major pullback or just something smaller
DeleteSeveral days higher for 20d high, I am watching this at the moment - https://invst.ly/u3ypk
ReplyDeleteWaves b-c(green) to complete the final zig-zag.
This weekend I have mentioned triangle because of the deep retracement lower. Now we have again deep retracement higher with complex structure double zig-zag or what ever it is. This fits better as a c-wave of a triangle than a-wave of a zig-zag.
For a triangle we need a d-wave or another retracement lower bigger than 62% below 3800.
From 3/4 low..rally into 3/12 or 3/19H +-1TD..C u..
ReplyDeleteI've written this in the previous column (if you read)
Deletethe move off the 3720 low looks like a corrective 3 wave with an ending pattern & trendline resistance at 3955 ish ...bit higher tomorrow .
ReplyDeleteZig-zag as it should be, another 15 points higher and we will have a=c plus the two legs up from February and now will have the same size.
DeleteI am starting to think this is the expected top.
You don't think this could be the end of B with C starting?
DeleteSomething like that until FOMC next week - https://invst.ly/u4buq
DeleteHi Krasi, many tech stocks tested 200dma. Doesn't it look like start of a new (longer term?) rally in tech?
ReplyDeleteI do not see such thing. I see a top and exhaustion - gap every day and selling the high look at the candles - https://schrts.co/hxbmwpQX
DeleteKrasi, what have been the last cycles high of 18 months and 4 years?, Thanks
ReplyDeleteMy count is 4y high September.2018 and 18m high January.2020
DeleteI am expecting a drop any day now similar to Aug-Oct 2011. I don't see a big drop like you outlined, I think we will go down to 3300 area.
ReplyDeleteAnd this is based on what?
DeleteWe have complex corrective structure and you are saying shallow 38% correction and continuation higher. How is this fitting in the big picture? Because from pattern perspective it makes zero sense.
This move from last year is similar to the 08 fractal. After that crash we had a 3 wave move up similar to where we are now then we went down to Oct 11 low and then continued higher. The sentiment is also very similar alot of people are expecting a big crash. After 08 crash people were expecting a big crash years later but missed out on some gains. I expect a 5 wave move down into June low that will be a good buy then we will continue higher. I doubt we break 3200.
DeleteNice fantasy good luck with that.
Delete