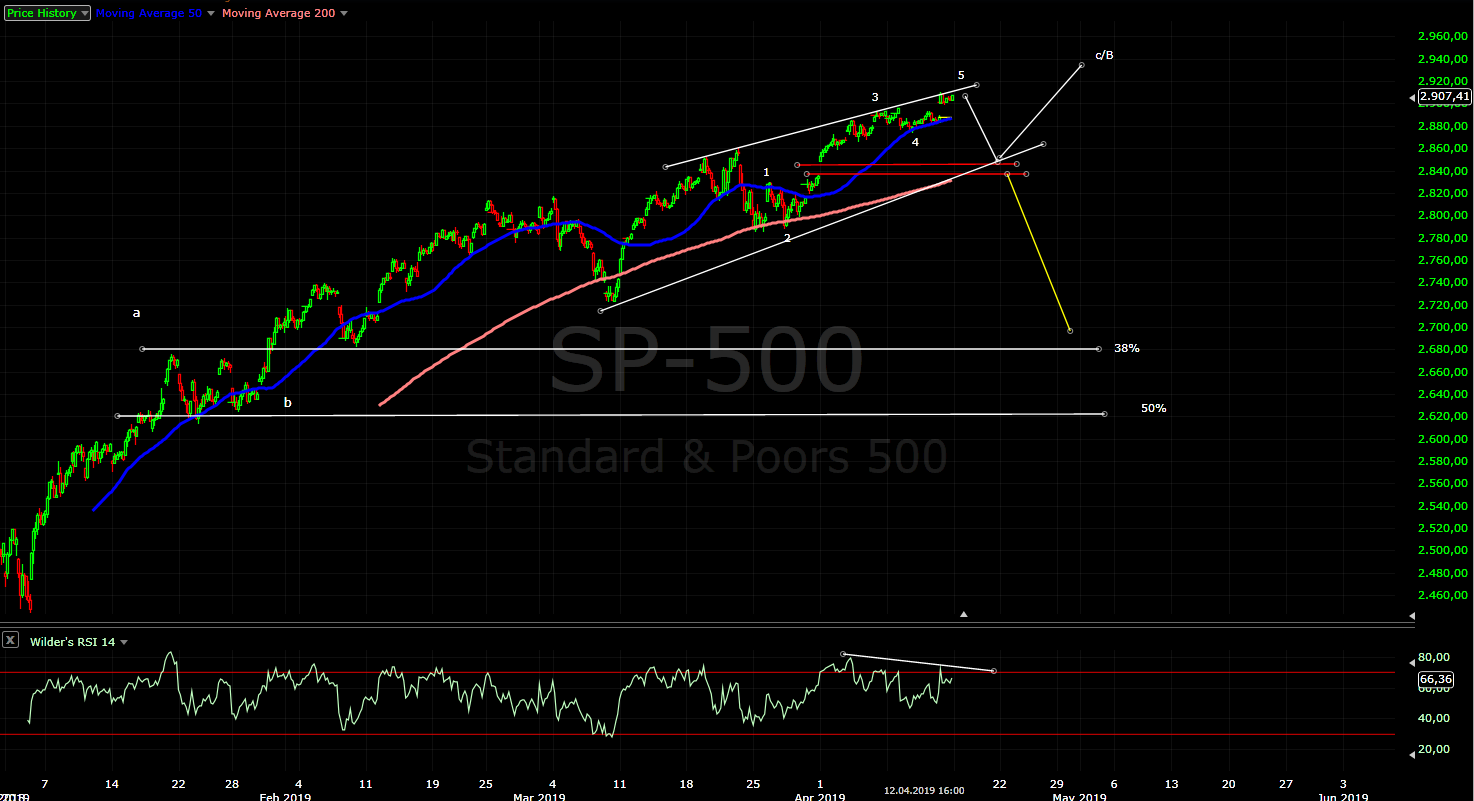
Short term - I will stick with this count until I see impulsive reversal. NYSE and DJIA with some corrective sideway move, SP500 drifting higher but I see three waves... either v/3 finishing as ED or flat for w4.

Intermediate term - pullback for 1-2 weeks for daily cycle low, to test support and MA50 followed by one more high will look great. This will be nice clean pattern.
Alternate is we have w-x-y from the low in Dec.2018, but I would not bet on such pattern until I see confirmation for reversal.

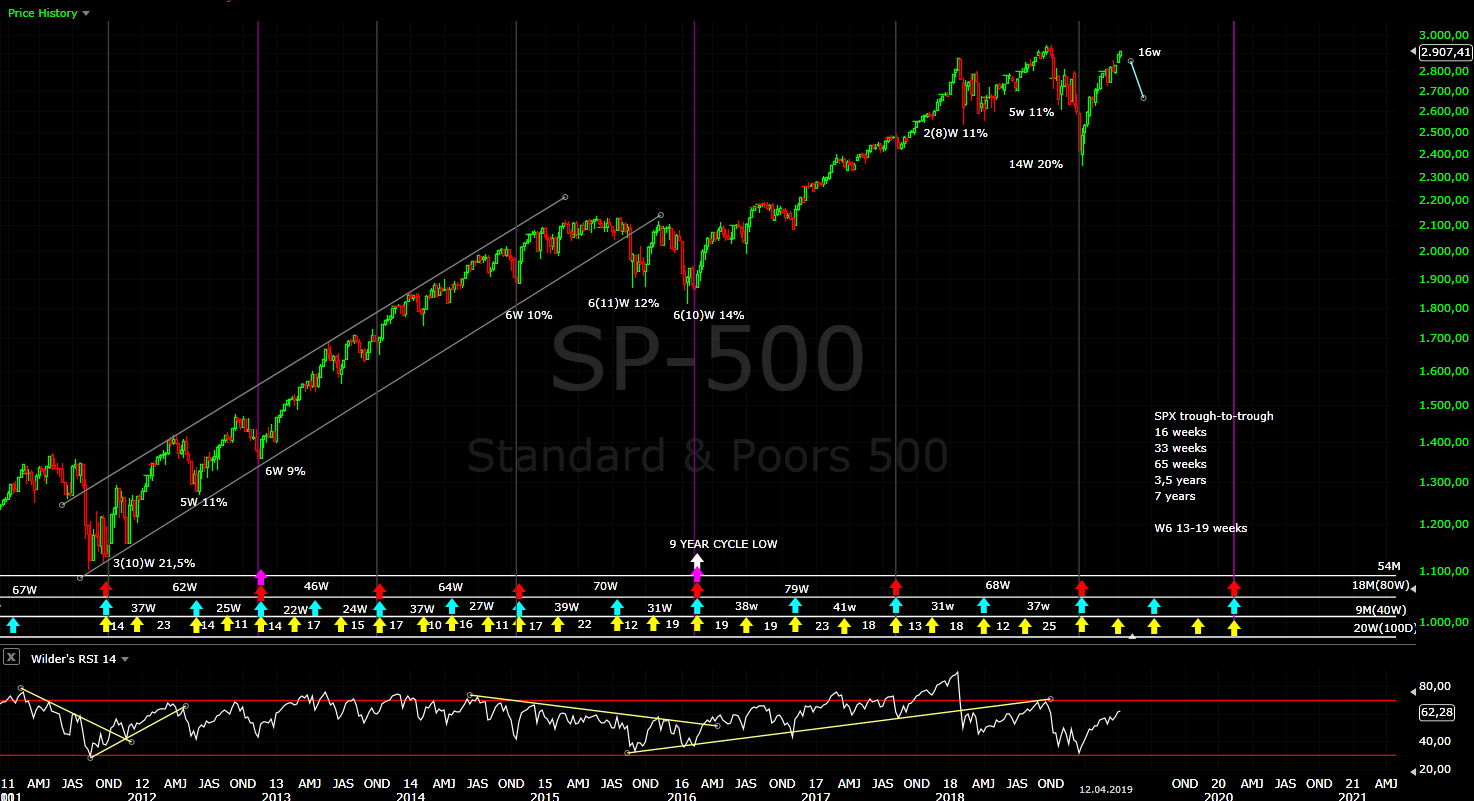
Long term - one more leg lower to finish wave IV from 2009. Decline in three waves and a low in Q1.2020 will fit better with cycles. I do not know how to count an impulse, but if I am wrong it is wave 1/V.

MARKET BREADTH INDICATORS
Market Breadth Indicators - weakness most of the indicators with divergences, the next bigger move is lower.
McClellan Oscillator - below zero.
McClellan Summation Index - sell signal with divergences.
Weekly Stochastic of the Summation Index - buy signal.
Bullish Percentage - turned lower.
Percent of Stocks above MA50 - divergences.
Fear Indicator VIX - refuses to go lower.
Advance-Decline Issues - divergences.
HURST CYCLES
Day 33, decline for 1-2 weeks for daily cycle low expected.

Week 18, I suspect stealth 20 week cycle low and the coming high is of 40 week cycle degree.