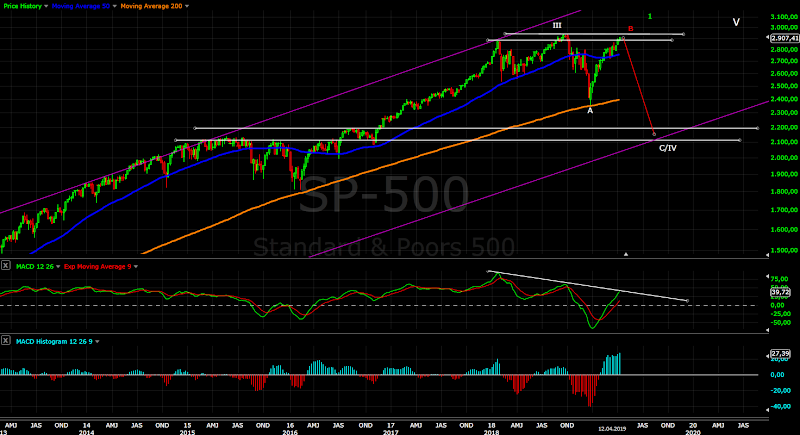
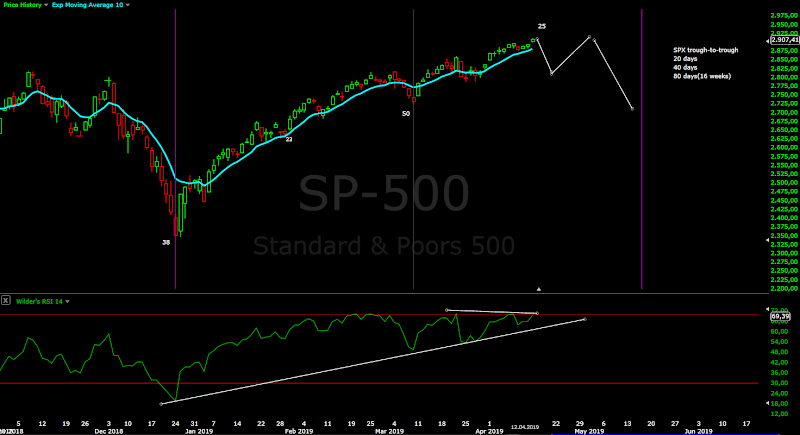
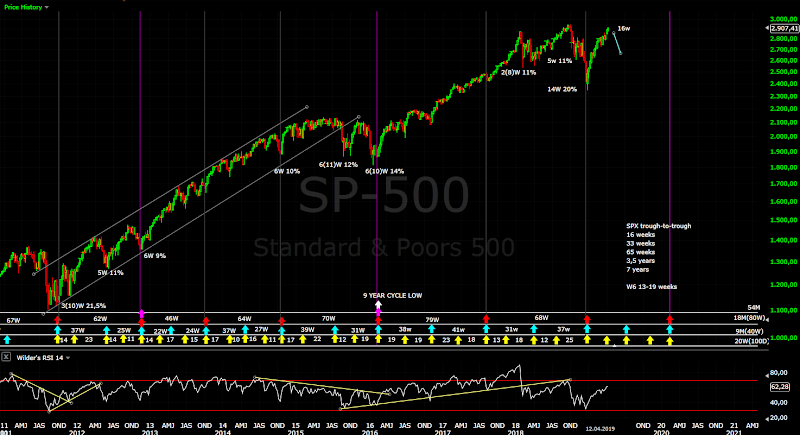
Grind higher which is not a surprise. The upper trend line was hit one more time with more divergences and now most of the indexes with 5 waves form the 25.03 low.I expect to see the indexes lower next week, but I have the feeling the real decline will be in May(last two charts). Lets see how the next week will look like.... in fact if you are bullish you want to see a decline NOW than you can count impulse an bullish 20 week cycle. With one more pullback and a high corrective structure will be confirmed.
TECHNICAL PICTURE and ELLIOTT WAVES
Short term - impulse from the last low with divergence so next week should be lower. For a reversal we need to see impulsive break below the trend line and the gap.
Intermediate term - late in the cycle with divergences... my feeling tells me one more pullback and a high to finish B.
Some have fantasy about 3000 we have to see acceleration higher in third wave from this levels, but with RSI at 70 I doubt it will happen. The real bullish scenario is decline now for 20 week cycle low and wave 2.
Long term - wave B(more exotic D expanding triangle) running for IV from 2009. If I am wrong it is an impulse wave 1.
MARKET BREADTH INDICATORS
Market Breadth Indicators - with divergences, the market looks tired , the time is getting ripe for correction.
McClellan Oscillator - lower high and divergence.
McClellan Summation Index - lower high and divergence.
Weekly Stochastic of the Summation Index - buy signal.
Bullish Percentage - buy signal.
Percent of Stocks above MA50 - lower highs and divergence.
Fear Indicator VIX - plunge to 12.
Advance-Decline Issues - divergence.
HURST CYCLES
The cycles are getting too stretched... I am starting to think that we have stealth 20 week cycle low in March and the coming high will be of 40 week cycle degree especially if we see one more high later in April and the decline in May.
Day 25 for the daily cycle.
Week 16 for the 20 week cycle.
Two charts DJIA and XOI for really nice finished patterns we need one more pull back and a high then the decline begins in May.
Energy sector and crude oil with very high correlation - both need one more pullback and a high for finished pattern.
Subscribe to:
Post Comments (Atom)


Thanks Krasi, continue to ignore the troll loser. Personally I feel like this market pattern looks like post July last year and could end at any time, impossible to predict when and where. It looks tired based on indicators, then all of a sudden re-accelerates out of nowhere. Leading indicators have become lagging indicators (e.g., RUT, copper, crypto, China), this whole mkt is a mess imo. p.s., S&P 3000 is only 3% higher, I wouldn't call that a fantasy ;) The upper trend line could easily be broken to the upside...VIX cratering to 12 on Friday into the close was either the greatest long of all time come Monday or telling us it will gap above.
ReplyDeleteThe trolls are great contrarian indicator. Two times most vocal at the top and I am sure they will nail it for the third time:) No fantasy at all, copy/paste the same crap thinking I will show emotions:)))) I can only laugh at them.
DeleteComparing with last year I would say late August VIX says the same:) this is my scenario above.
love your blog Krasi!
ReplyDeleteAny hint on where we are in Tom Demark studies please ?
ReplyDeleteOn the daily chart there is finished sell setup from the last low, but no price flip.
DeleteThe same on the weekly chart finished sell setup from the December low, but no price flip.
Thank you Krasi. Can you explain a little more about the coming high will be of 40 week cycle ?
ReplyDeleteThe average cycle length for 40 week cycle is something like 32-36 weeks.
DeleteThe average cycle length for 20 week cycle is something like 14-18(many times seen 12,13 weeks).
In previous occasions with such oversold market breadth indicators(2002/2008/2016) what followed is 10 weeks vertical move and 10 weeks consolidation - clean 20 week cycle and reset for the indicators. Now we have 16 weeks higher and no reset for the indicators.
As I wrote this weekend if we see reversal and a few weeks lower we can argue impulse, 20 week cycle low, bullish etc. With another 2-3 weeks higher the cycles will look negative for me.
Why? - 19-20 weeks higher and 3-4 weeks lower... for me there is no 20 week cycle with length 24-25 weeks. More likely we had already 20 week cycle low(RUT,DJT,DJI,XLF 13 weeks length which is ok) and the second 20 week cycle is running.
On the other side counting from top to top we are at week 29(current will be 30) - this smells like 40 week cycle high.
All this means turn lower now will look bullish(2-4 weeks lower 10 weeks higher) turn later in 2-3 weeks and with high probability the 40 week and maybe the 18 month cycles turned lower which is very bearish - B wave.
B wave?, it would be C wave to 2100
Deletevery nice
ReplyDeleteDon't you think it' wave 5 of 5 from 2009
ReplyDeleteIt does not fit very well. Look at NYSE I do not believe that at major high we will see such index which does not confirm the count.
DeleteIf the correction is finished it is i of 5 from 2009.
hey krasi how high could spx go into april 22 which is the top date if im not mistaken could we hit 2950 first?
ReplyDeleteIt should decline until the end of the week. I can not say the price on Monday, but I do not expect 2950.
Deletelooks like new high coming
ReplyDelete2 points per day, it is getting ridiculous....
DeleteHi all ! It looks like we will be hitting new highs soon. Krasi, how do you explain that your analysis was so spectacularly wrong ?
ReplyDeleteHow do you continue to be so spectacularly retarded?
Deletedude get a life... go kick rocks..
DeleteDid not deleted this one on purpose.... good example for the stupidity of the herd(Joe bag holder).
DeleteMoney is like drugs, it makes people do stupid things.
The sheeple is now high because of easy money and they do not like the message that hangover will follow. It does not matter if I am right or wrong they will come here telling me that I am wrong.... like 10 points higher will make any difference:)))
This makes them feel better, that everything is ok and there will be no hangover, not this time.... this time I am wrong at last:)
They do not get it that their is no easy money and they can not learn not to attach emotions to trades.... it is easier to be high, it feels so good:)
Well I have a news for you it did not work twice and the third time will not be different.
Exactly the same 3 messages copy/paste like the previous two tops.
Anonymous guys - is not it embarrassing to be "spectacularly wrong" over and over again?
Why are you disappear and hide every time when you are wrong?
P.S. Unknown why are showing emotions they are just pitiful want to be trader guys.
markets annoying
ReplyDeleteKrasi, you are grat, keep going to write us
ReplyDelete+1000000
DeleteTriple top now on spy as it was back in 07-08 for utilities? please comment...I know it is quite simplistic but the formation looks VERY similar...
ReplyDeleteSome see flat correction, other expanding triangle, Head&Shoulders, triple top....
DeleteMy opinion is clear that there is one more leg lower below the Dec.2018 low.
If you mean with triple top the bull market is over - no for me this is just a correction.
If it's wave 1, what the value you the s&p has to arivar?
ReplyDeleteI do not know how to count it as an impulse so I do not have a target either..... for me this is corrective structure.
DeleteFor an impulse the high should have been in February, where I was forecasting lower for wave b or 2 - it did not work.
Krasi please, comments of 15-17 April. Why is wave B and not wave C? thanks
ReplyDeleteI do not understand.... C from what?
DeleteI do not understand: the 18 month cycles turned lower which is very bearish - B wave.
ReplyDeleteWhy is it a bearish B wave ?
It is bearish because it will confirm the advance is B wave and we will see new lows.
DeleteNew lows (2100-2200) in July-August for 18 months 4 year cycle low ?
ReplyDeleteOnly if the scenario with shorter 18 month cycles play out..... but it is looking less likely with every passing week.
DeleteIf it were to play out in your favor, when would you expect it to hit new lows?
DeleteThe time windows have not changed - July-August for shorter 18 month cycles and Q1.2020 for longer 18 month cycles(the weekly cycle chart above).
DeleteWhat is changing is - the longer it takes the more likely the main scenario is playing out 4 year cycle low Q1.2020.
Wave C and a low July-August is possible, but it should move straight lower without a pause....