Feb 27, 2013

Short term update

UPDATE - 28.02.2013 : The system issued buy signal today. I would wait for a pullback for a long trade.... there is divergence on the 15 min chart. Pullback should be in the 1510-1515 area - support, EMA50 on the hourly chart and 38,2% Fibo. Beware bellow 1510 it still could be X wave.
The histogram on the daily chart is rising and there is triple cross on the hourly chart so the odds point higher. See the chart bellow the trend line is around 1545. If we see failure again... than it is some ugly top.


UPDATE: channel busted:) the picture is not clear it still could be an X wave but the pullback could be over too. In wait and see mode.... waiting for higher low or lower high - a trade with low risk.
Look at the hourly chart of DJ and you will understand why in wait mode. Megaphone in Megaphone... one month WTF!?!?!? until everybody give up:)
My gut tells me expect higher low than higher high with divergence. Not much different from my plan for a choppy correction but I was expecting to see something at least around 1475 to test the previous top SP500 made it only to 1485...


UPDATE: wedge busted it is now a channel... SP500 stop moved above resistance at 1515 (resistance 1514 which is 61,8% retracement too)


I told you - do not expect waterfall just choppy correction. The structure itself confirms my expectations and says that we should not expect a lot from this move lower. Ugly but it is what it is.

Ok the projection from yesterday is close enough, no pullback for several points just pause around resistance and higher to the yellow line.
The updated chart bellow - the upper wedge line reached and EMA50 on the hourly chart is tested again.... now the indexes should move lower again or the correction is over. I has not touched the upper yellow line:) I swear pure luck:))

Feb 26, 2013

Short term update

The speculation for the short term path from yesterday worked very good so the next one:)

Short term update

Another support level broken, another confirmation that the direction is down. Trading system - stop moved to break even. As I have said their will be a second chance for an entry - it was yesterday with the test of 1514 and EMA50 on the hourly chart.
McClellan Oscillator and VIX are outside their boillinger bands so expect something in the opposite direction, not a rally more like small green day or sideway action.
Speculation how the path for the pullback can look like. Main plan stays the same - pullback 1475-1470, retracement probably to 1515 and than move lower to ~1400.

Feb 25, 2013

Short term update

UPDATE: The bearish action is now confirmed with retest of 1514. It looks like some broadening formation (lasting almost one month) and this leg has not managed to make higher high which means that we should see a break to the downside.
Watching again the main scenario, the green one on the hourly chart bellow.


UPDATE: The hourly chart looks now bearish the price is testing 1514 and the EMA50 (both now resistance)


Very confusing action.... ugly drop and ugly daily candle but the price is just testing 1514 again (support now) and on the daily chart it looks like the histogram is trying to turn up so I am more bullish than bearish(see the red scenario on the hourly chart) for now. We must see the close for more information, but the picture is bearish again only bellow 1514.

Feb 23, 2013

Weekly review

Short term view - the move up does not look finished, but it should not last for a long either.
Intermediate term view - we are in a topping process before a real correction of about 8%-10%.
Trading system signal (swing trading) - Direction:DOWN | Last entry signal: at SP500=1510 on 21.02.2012 | Stop at: 1533

The week played out perfect according to my forecasts - up to ~1532, lower after FOMC to support ~1500 and up to resistance ~1514. The only surprise for me was that the move lower started before the FOMC minutes.

Next week looks difficult to predict the short term. If the indexes reverse on Monday or Tuesday in the 1515-1520 area then watch the next support level 1475-1470. If they continue higher expect marginal new highs before reversal. As I have already wrote do not expect this first move lower to be waterfall it will be choppy pullback. I think we are witnessing a topping process similar to Mar-Apr 2012 and Sept-Oct 2012. Look at the choppy moves up and down for weeks. Such turns lasting only 2-3 days are difficult to predict.
In short - next week we should be flexible turning long or short but eventually the gravity will win and the next bigger move is lower.

TECHNICAL PICTURE
Short term - is not clear. SP500 closed at resistance and EMA50. As I have wrote reversal on Monday or we will see another signal up triggered.

- Triple cross(EMA10 and EMA20 crossing EMA50) - we have a triple cross pointing lower but on Monday we need reversal lower or we will see another triple cross up.

Intermediate term - topping process similar to Mar-Apr 2012 and Sept-Oct 2012. Waiting for the real correction, we will witness pullbacks up and down for a while.

- Trend direction EMA50/MACD - MACD is still pointing lower and we have a cross. Prices are above EMA50 and MACD above zero so this should be a correction in an UP trend.
- Momentum Histogram/RSI - momentum turned up. The bears need a reversal on Monday or the short term direction will turn up again.

Long term - No change waiting for correction and another move higher.

- Trend direction EMA50/MACD - MACD above the zero line and price above EMA50, the long term trend is UP. Quadruple divergence on MACD watch this veeeery carefully.
- Momentum Histogram/RSI - momentum turned lower which is a warning for a pending correction.

Cyclical Bull Market - I was playing this week with the monthly chart and find it interesting enough to share it.
TD Sequential and EW support my view that there is several months of upward pressure (green Y on the weekly chart above) and after that we should see serious move lower.


MARKET BREADTH INDICATORS
The Market Breadth Indicators - all issued sell signals confirming that move lower has begun.
McClellan Oscillator - always when the oscillator overshoots the BB a pullback in the opposite direction follows. The move up on Friday was expected.
McClellan Summation Index - issued sell signal.
Weekly Stochastic of the Summation Index - sell signal.
Bullish Percentage - issued sell signal.
Percent of Stocks above MA50 - confirmed the weakness moving bellow 75.
Fear Indicator VXO - moved sharp to the upside and overshooted the BB too, which means expect a move in the opposite direction.
Put to Call Ratio - at elevated levels telling us that we a re to a top.
Advancing issues volume - made lower low confirming the move lower.
Declining issues volume - made higher high confirming the move.


HURST CYCLES
Day 13 of the 20 day cycle. I do not think that was the bottom for this cycle. There is another 5 to 10 trading days before it bottoms which means the low of the cycle should be bellow 1498.

The cycle is mature at week 14 of 20 week cycle. 20 week and 18 month top should bring decent correction but the fact that they are topping late in the cycle means to expect more upside after that.


Tom Demark SEQUENTIAL AND COUNTDOWN - this technique spots areas of exhaustion.
Currently at 3 of a buy setup. Sp500 should close bellow 1511 on Tuesday so that the setup is not negated.
Nothing interesting on the weekly chart, the first red bar on the SP500 weekly chart. Eventually the correction should materialize.

Feb 21, 2013

Short term update

Yesterday was clear that a pullback has begun long before the close, when after the FOMC there were no move higher. Today is official with sell signal from the system short after the opening... around 1510.
I am short DAX at 7736 from yesterday short after FOMC. DJ and SP500 are near to support so I think that soon there will be another opportunity for an entry.

Here is the chart, soon was really very soon:) 1514 looks like interesting target where all trend lines and resistance are crossing.

Feb 19, 2013

Short term update

UPDATE: end of the day SP500 closed bellow 1514, bearish candle... so the pullback has begun. After a lower high the system will generate short signal too.


UPDATE: Ok now we have ugly dark cloud cover candle... triple cross on the hourly chart is still missing. After minor low and a move higher any lower high or higher high with divergences will trigger a short signal. DAX has begun its next leg down. The odds are good that we saw the top and a pullback has begun.


UPDATE: Pushing lower before FOMC.... usually the moves before FOMC or NFP are fake moves in the opposite direction. So not interested at all.


Its not a big surprise what we are seeing today... probably something like this bellow is the path.

Feb 16, 2013

Weekly review

Short term view - short term another move higher 1530-1535. Nothing bearish until 1514 is broken.
Intermediate term view - pullback 3%-4% expected 1475 +-5points and another higher high.
Trading system signal (swing trading) - Direction: UP | Last entry signal: at SP500=.... on xx.xx.xx | Stop at:

No surprises, another boring week. The range is so small... it is not possible to trade at all.

I have changed my view how the things will play out. I expect standard pullback 3%-4% before another move to higher high with nice divergences followed by a real 8%-10% correction.
The shocker - we are in the middle of the pullback:) I know you can not see it. SP500 chart is the wrong place. Take a step back and look at the indicators - they are saying we are correcting. DJ second red week, DAX the correction is real all my shorts are profitable. I think we will see another week churning up and down, followed by sharp but short living 3%-4% move lower.

Now I saw that there is FOMC meeting on Wednesday. If the pattern repeats again we will see the indexes pushing higher until the meeting and reverse after that. At least it should get the ball rolling... the last 2-3 weeks were not easy to trade if at all possible to trade.

TECHNICAL PICTURE
Short term - a closer look of the hourly chart. Support 1514 has been tested three times and have another bounce of it. MACD looks like it wants to turn up from the zero line. I think SP500 will try to move higher again next week. The range is 10 points with target 1535. Bearish thoughts only when we see the price bellow 1514.
- Triple cross(EMA10 and EMA20 crossing EMA50) - the EMAs are still pointing up so the short term trend is up. We have MACD divergences so we must watch out for a reversal.

Intermediate term - As I have said I have changed my view - standard pullback 3%-4% before another move to higher high with divergences followed by a real 8%-10% correction.
Target for the pullback 1475 +-5 points - support from the previous high,MA50,38%-50% Fibo for the move since 31.Dec,3%-4% from the expected top.
If I am wrong this is just a pause and we will go higher... to the moon:)

- Trend direction EMA50/MACD - MACD pointing lower with a cross - we are in some kind of a correction. Prices are above EMA50 and MACD above zero so this should be a correction in an UP trend.
- Momentum Histogram/RSI - the histogram is bellow zero with divergences and RSI made another lower high.... we are in some kind of a correction.

Long term - the way an intermediate term top will play out does not change the bigger picture - it stays the same.

- Trend direction EMA50/MACD - MACD above the zero line and price above EMA50, the long term trend is UP. Quadruple divergence on MACD watch this veeeery carefully.
- Momentum Histogram/RSI - RSI and the histogram are now flat. Is momentum starting to shift from up to down??? We will have to wait several weeks.


MARKET BREADTH INDICATORS
The Market Breadth Indicators - no change - in overbought territory but no sell signals, just warnings.
McClellan Oscillator - SP500 making new highs, the oscillator is moving below he zero line - "hidden correction":)
McClellan Summation Index - flat for third week, no sell signal yet...
Weekly Stochastic of the Summation Index - issued sell signal, waiting for price confirmation that a swing lower has begun.
Bullish Percentage - still bullish...
Percent of Stocks above MA50 - moving lower... looks like the stocks participating in this rally are getting less and less.
Fear Indicator VXO - testing the bottom again
Put to Call Ratio - near to another top??
Advancing issues volume - can not make higher high, the indexes are advancing but the volume does not.
Declining issues volume - jumped a lot and is near to making higher high... is the pullback around the corner??
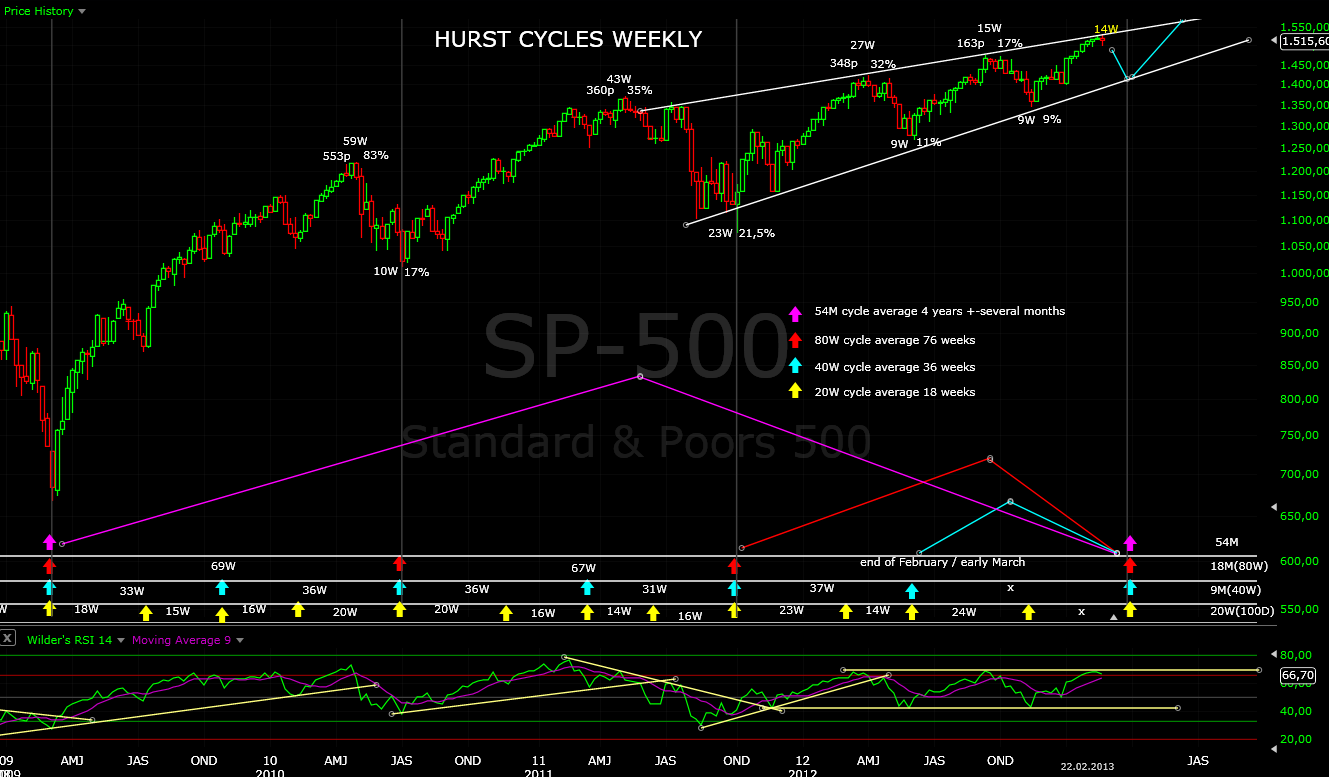

HURST CYCLES
Currently at day 9 of the 20 day cycle and more upside is expected. The low of this cycle should be the low for the pullback which I am expecting.
Currently at week 13 of the 20 week cycle. The dominant 20 week cycle should take control in the next 2-3 weeks and bring a bigger correction of 8%-10%.


Tom Demark SEQUENTIAL AND COUNTDOWN - this technique spots areas of exhaustion.
Combo 13 finished last week currently we have 9 from a countdown... will it be finished? I do not know. SP500 is moving up but the move is very weak.
The finished Combo and Countdown look like they have failed. As I have written I think we are in a "hidden" correction which is better visible in DJ - two red weeks, or in Europe where it is not hidden at all:) SP500 is just the wrong place to look for or to trade.

Feb 13, 2013

Short term update

UPDATE 15.02: Closed DAX short at 7615 positive divergence at support with 5 waves lower. Now all indexes point short term higher.


UPDATE: DAX trade ok, the SP500 bounced of support and EMA50 on the hourly chart ~1514 and now looks bullish again:))) only break bellow 1514 will trigger something bearish. Obviously it is a better idea to short weakness and this is Europe at the moment.


UPDATE 14.02: DAX has plunged hard only for few minutes, I have managed to jump on the train in the last moment. The charts look now bearish, for the USA indexes too....


UPDATE: I think false alarm again and closed for 10 points profit. SP500 and DJ pointing short term higher again.For three days the trend line moved higher and now is around 1530.


UPDATE: short DAX at 7715... there is no confirmation but I will take the risk:) five waves lower and three waves up...


Ok three days later SP500 reached its target 1525, Russell 2000 reached its target for the measured move ~919, DAX reached its target for the correction A=C at 7730. Now its getting interesting - are we going to see at last some kind of weakness.

Feb 9, 2013

Weekly review

Short term view - more on the upside, the trend line currently around 1525.
Intermediate term view - after this short term move finishes an intermediate term correction should start.
Trading system signal (swing trading) - Direction: UP | Last entry signal: at SP500=.... on xx.xx.xx | Stop at:

Eventually we have higher high as expected - 4 points for the week:) but after a lot of fake moves up and down. On Monday we saw huge red bar closing bellow the Friday's bar and I thought that a correction has begun, the system generated signal which was later negated (5 points loss, not a drama). I have to mention that DJ is red for the week and the correction for the DAX has already begun but short term all three indexes point up.

For the next week I expect to see higher prices. Target is at least the trend line on hourly chart ~1525. After that the correction should begin.
The charts are bellow nothing has changed just more divergences....

TECHNICAL PICTURE
Short term - more upside expected. The trend line is adjusted a little bit higher and a move up will touch it around 1525 +- several points.
- Triple cross(EMA10 and EMA20 crossing EMA50) - the EMAs are still pointing up so the short term trend is up. We have MACD divergences so we must watch out for a reversal.

Intermediate term - nothing has changed... I still think that in the the next several weeks we will see a correction - target between 1430-1450 which is support/lower wedge trend line/38,2%-50% Fibo.
- Trend direction EMA50/MACD - MACD starts pointing lower it smells more and more like correction. Prices are above EMA50 and MACD above zero so this should be a correction in an UP trend.
- Momentum Histogram/RSI - the histogram is bellow zero with divergences and RSI made another lower high.... momentum does not look good.

Long term - no change, expecting this wave to finish and correction for several weeks.
- Trend direction EMA50/MACD - MACD above the zero line and price above EMA50, the long term trend is UP. Quadruple divergence on MACD watch this veeeery carefully.
- Momentum Histogram/RSI - RSI and the histogram are pointing higher and momentum is UP.


MARKET BREADTH INDICATORS
The Market Breadth Indicators - no change - in overbought territory but no sell signals. Some early signs of a trouble are the VXO divergence and Percent of Stocks above MA50 and McClellan Oscillator making lower highs.
McClellan Oscillator - another lower high, another divergence.
McClellan Summation Index - flat for second week, no sell signal yet...
Weekly Stochastic of the Summation Index - issued sell signal, waiting for price confirmation that a swing lower has begun.
Bullish Percentage - flat for several weeks, no sell signal...
Percent of Stocks above MA50 - making lower highs...
Fear Indicator VXO - higher low and divergence... not good for the bulls.
Put to Call Ratio - making lower highs...
Advancing issues volume - another lower high, the indexes are advancing but the volume is shrinking.
Declining issues volume - another higher low, the indexes are moving up but the volume on the downside is expanding.


HURST CYCLES
The smaller cycles are difficult to distinguish because the bigger cycle is dominant. I think we saw 20 day cycle low on Monday which explains the weakness for several days and the strength which we see now. The European indexes confirm this making a visible move lower for example the DAX with 3% pullback. Currently at day 4 of the next 20 day cycle and more upside is expected but the dominant 20 week cycle should take control soon.
We are currently at week 12 of the cycle. I expect correction in the next 4-5 weeks to finish this cycle.


Tom Demark SEQUENTIAL AND COUNTDOWN - this technique spots areas of exhaustion.
The TD Combo was completed on Friday. We have now completed TD Sequential followed by completed TD Combo. Combined with the weekly chart bellow I think that the correction is around the corner.
SP500 refuses to move lower but eventually it will do it:) The exceptions after finished TD Sequential on the weekly chart show the correction is delayed for 2-3 weeks but it will come.
We have hanging man on the weekly chart and DJ was in the red. The indexes are not much higher that the recorded 13 for the sequential.

Feb 6, 2013

Short term update

UPDATE: SP500 opened higher and as I wrote in the comments that means to expect something around 1520. The index is testing the trend lines on the hourly and daily chart this is the target 1520 plus minus several points. Eventually is happening what I wrote on the weekend but the path... was more than difficult:)
I will post the charts tomorrow... nothing has changed more and more divergences and another TD Combo 13 on the daily chart finished.


UPDATE:I have closed my DAX position after the gap.. 50 points gain. The move up did not look good and I was right when I see what is happening now.
Looking at the daily chart a correction should have begun... but after so many fake outs:) confirmation is close bellow 1495.
My experience with such moves - the big guys make you crazy until you give up and than the expected correction plays out.
Great observation from binve...


UPDATE: Looks like some consolidation/triangle which means continuation. DAX shows divergences on the 1h chart at support... I am now long on the DAX.


Ok close SPX shorts 1508 - 5 points loss.... it takes too much time so I think there will be more on the upside - see the chart from the previous post, it points to ~1520. Do not expect a rally for several weeks, we just have not seen the top. It will take more time to play out.
That is not very bullish because the excess is not cleaned up and subsequent move lower will be deeper.
The signal was good enough, it just did not worked out this time. Now waiting again to see something interesting...
I have been asked what I am trading - in fact I was trading DAX and I took my profits.... I have had luck trading the right index this time:)

Feb 5, 2013

Short term update

UPDATE: Wow you do not see such thing very often - strong up day, strong down day and again strong up day.... schizophrenic market.
Infect this is bearish candlestick formation called "Bearish Stick Sandwich". We can see new highs, but that is part of a topping process for me.
For example the DAX has not reacted at all.... and it is far away from the highs.


Weakness in the afternoon session and H&S or move higher to ~1520 at least. The two scenarios are shown on the chart bellow....

Feb 4, 2013

Short term update

Short at SP500 1503...
The odds are good - bearish candle formation which means high probability that Friday was an exhaustion bar,RSI and histogram divergences, the histogram moved bellow zero, MACD divergence on the hourly chart, the price is bellow EMA50 on the hourly chart.
Confirmation is daily close bellow 1496...

Feb 2, 2013

Weekly review

Short term view - on the smaller time frames the move does not look finished but I think that any move higher should be short living.
Intermediate term view - a top is expected and correction for several weeks... wait first for confirmation from the price.
Trading system signal (swing trading) - Direction: UP | Last entry signal: at SP500=.... on xx.xx.xx | Stop at:

The most interesting for the week was the spike on Friday which could be the exhaustion bar which I am waiting for. The next 1-2 trading days will give us the answer. The two red days are the first cracks in this uptrend which I think is nearing its end.
I know I know, there is contradiction between analysis and trading which I present. I have tried to explain it last week. The charts are telling expect a correction but I can not nail the top and I am not trying. Important is the trading signal which keeps me on the right side and its still up.

Next week - I think that SP500 has not hit the high for the move but any move higher should be short living. Still waiting to see something to confirm that a move lower is starting until then the direction is up and I am waiting.
If I am wrong an acceleration higher should start but with this indicators.... such thing I will see for the first time.

TECHNICAL PICTURE
Short term - I think we will see one more push higher but short living. The MACD divergence is getting bigger and bigger, the trend line is still respected.
- Triple cross(EMA10 and EMA20 crossing EMA50) - the EMAs are pointing up so the short term trend is up. We have MACD divergences so we must watch out for a reversal.

Intermediate term - nothing has changed... the bar on Friday is a good candidate for an exhaustion bar. The problem is that too many people are watching now the wedge trend line. We need probably fake break out before we see a capitulation on the upside.
I still think that in the the next several weeks we will see a correction - target between 1430-1450 - support/lower wedge trend line/38,2%-50% Fibo.
- Trend direction EMA50/MACD - pointing up so intermediate trend is UP.
- Momentum Histogram/RSI - RSI and the histogram are pointing higher and momentum is up. But I have to mention that they have lower high and SP500 made higher high. The index should continue rallying or we will have a divergence for this last move.

Long term - no change, expecting this wave to finish and correction for several weeks.
- Trend direction EMA50/MACD - MACD above the zero line and price above EMA50, the long term trend is UP. Quadruple divergence on MACD watch this veeeery carefully.
- Momentum Histogram/RSI - RSI and the histogram are pointing higher and momentum is UP.


MARKET BREADTH INDICATORS
The Market Breadth Indicators - no change - in overbought territory but bullish. First signs of troubles appearing - VXO higher low, Percent of Stocks above MA50 and McClellan Oscillator lower highs.
McClellan Oscillator - another lower high, the divergence is getting bigger.
McClellan Summation Index - bullish moving up.
Weekly Stochastic of the Summation Index - says that the move is mature... but no sell signal for now.
Bullish Percentage - bullish on buy....
Percent of Stocks above MA50 - the index made higher high, the indicator not. First warning sign of an exhaustion.
Fear Indicator VXO - plunged 11% on Friday smells like capitulation... I expect to see a higher low.
Advancing issues volume - another lower high, the indexes are advancing but the volume is shrinking.
Declining issues volume - another higher low, the indexes are moving up but the volume on the downside is expanding.


HURST CYCLES
The smaller cycles are difficult to distinguish because the bigger cycle is dominant. We have the same situation like the previous 20 week cycle from June to November. The bigger cycle is well visible and the smaller ones are hard to see. So it is a better idea to concentrate on the bigger one - the 20 week cycle. The expected top should be the top of the 20 week cycle.
We are currently at week 11 of the cycle. After a longer cycle comes usually a shorter one. See the previous sequence 23-14. I expect the same outcome - correction in the next 4-5 weeks to finish this cycle.


Tom Demark SEQUENTIAL AND COUNTDOWN - this technique spots areas of exhaustion.
On the daily chart there is combo running at 10 which probably will finish next week. That confirms the short term picture.
SP500 reached point of exhaustion... we know that. The question is now when a correction will start. I will wait for my system to give me the sign.