
Dec 28, 2024
Update
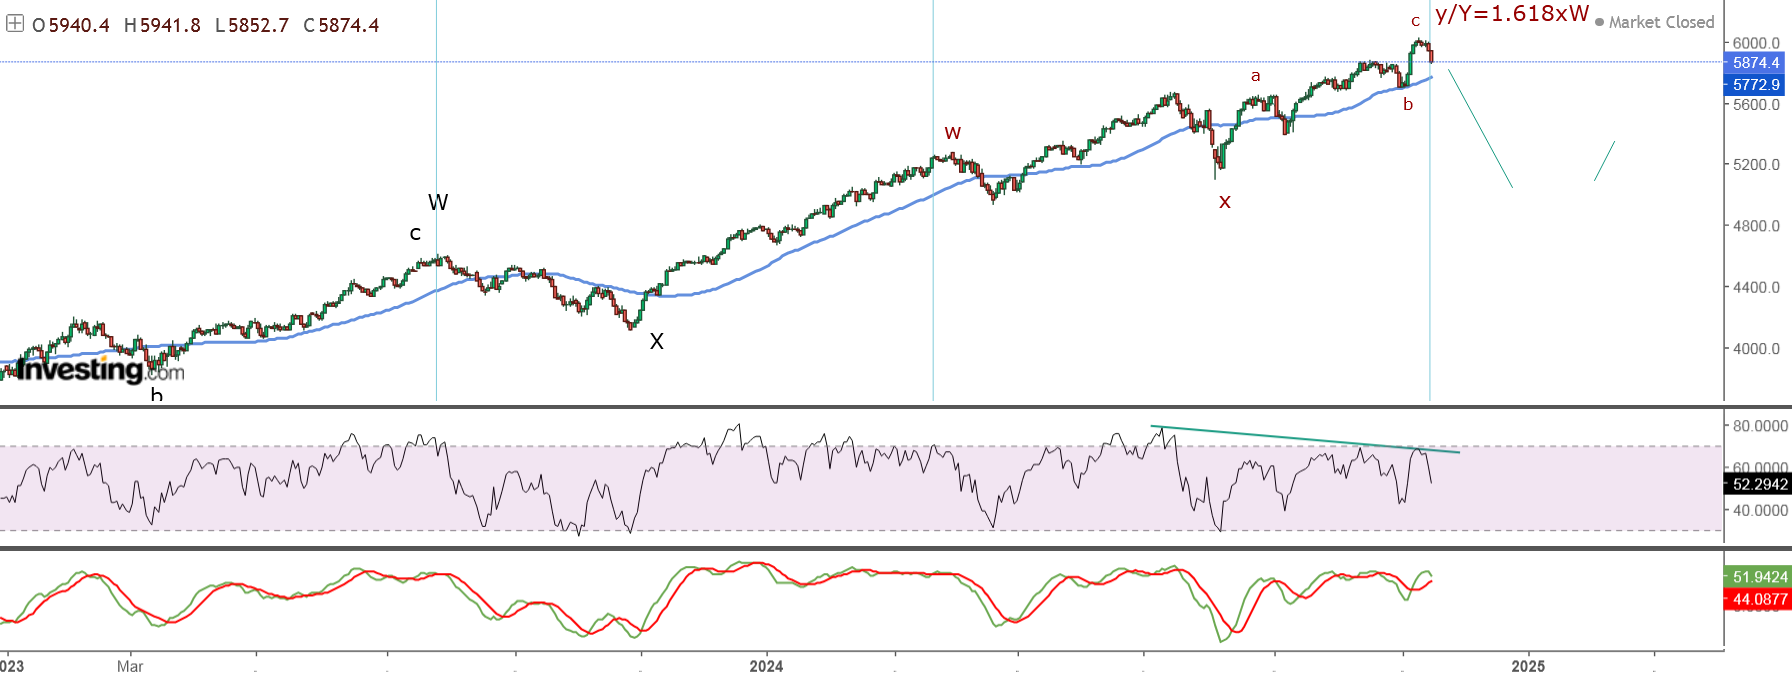
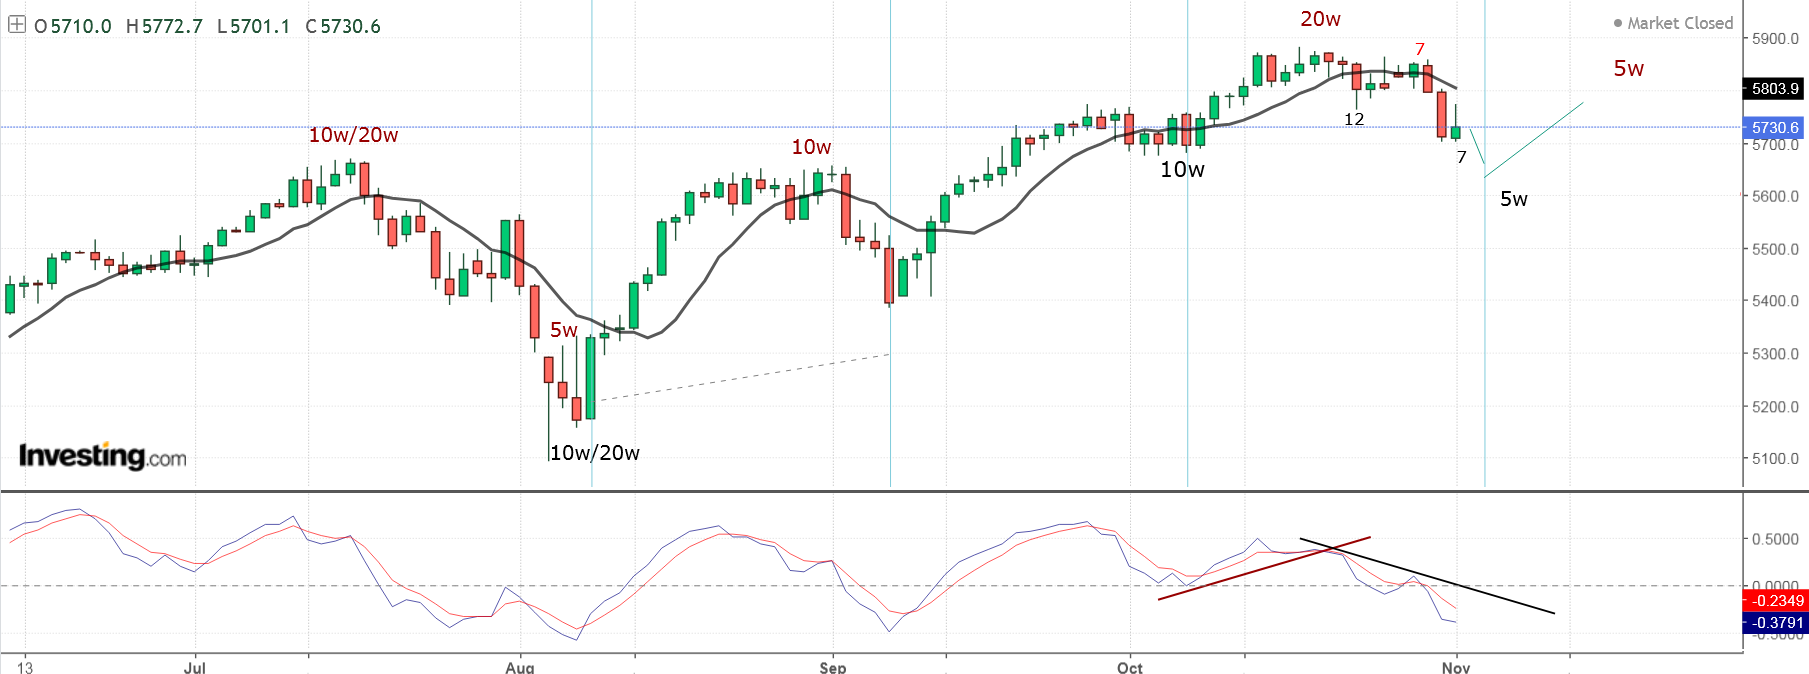
Retracement and possible H&S pattern. Target for this pattern and another decline with 1.618 extension is MA200 on the daily chart.

Dec 21, 2024
Weekly preview
NDX/SPX followed the other indices with one week delay. The move from the August low is complete and with very high probability correction for 3-4 months into 40w low should follow(see the DJ chart from previous week).
Short term either we have a low or early next week and higher for the holidays.
TRADING
Trading trigger - sell signal.
Analysis - long term important top it could be 4y cycle high. Intermediate term turn lower into 40w cycle low.
P.S. - for a trade both analysis and trigger should point in the same direction.
TECHNICAL PICTURE and ELLIOTT WAVES
Short term - The second leg lower has 4,236 Fibo extension and it should be extended third wave... this is not typical for c-wave. But for an impulse I want to see one more leg lower... even with sligthly higher low - 5=1.618x1 is between the two lows iii/3 and v/3. The RSI trend line has not been so the move lower is intact.
Intermediate term - the first target should be MA200 and support in the 5600-5700 area.
Long term - double zig-zag(from 2020) for y/B at 9y cycle high 2000-2007-2015-2024.
MARKET BREADTH INDICATORS
Market Breadth Indicators - oscillators with oversold levels... bounce and one more decline expected.
McClellan Oscillator - oversold level and retracement.
McClellan Summation Index - sell signal.
Weekly Stochastic of the Summation Index - sell signal.
Bullish Percentage - in the middle of the range.
Percent of Stocks above MA50 - oversold level.
Advance-Decline Issues - oversold level.
Fear Indicator VIX - spike higher and retracement.
HURST CYCLES
Short term cycles - 20d low in the next days(or hit already) and retracement higher for 5w high.
Speculating that we have three extended 10w cycles for the 40w cycle...
Completed 40w cycle high at week 36, in the upper range of the time band, but still average length which is 32-36 weeks.
Now we should see move lower into 40w cycle low. If it has average length the low should be late March/early April.
Maybe we will see 40w cycle, which visualy divides in three... like this
Trading trigger - sell signal.
Analysis - long term important top it could be 4y cycle high. Intermediate term turn lower into 40w cycle low.
P.S. - for a trade both analysis and trigger should point in the same direction.

TECHNICAL PICTURE and ELLIOTT WAVES
Short term - The second leg lower has 4,236 Fibo extension and it should be extended third wave... this is not typical for c-wave. But for an impulse I want to see one more leg lower... even with sligthly higher low - 5=1.618x1 is between the two lows iii/3 and v/3. The RSI trend line has not been so the move lower is intact.

Intermediate term - the first target should be MA200 and support in the 5600-5700 area.

Long term - double zig-zag(from 2020) for y/B at 9y cycle high 2000-2007-2015-2024.

MARKET BREADTH INDICATORS
Market Breadth Indicators - oscillators with oversold levels... bounce and one more decline expected.
McClellan Oscillator - oversold level and retracement.
McClellan Summation Index - sell signal.
Weekly Stochastic of the Summation Index - sell signal.
Bullish Percentage - in the middle of the range.
Percent of Stocks above MA50 - oversold level.
Advance-Decline Issues - oversold level.
Fear Indicator VIX - spike higher and retracement.
HURST CYCLES
Short term cycles - 20d low in the next days(or hit already) and retracement higher for 5w high.
Speculating that we have three extended 10w cycles for the 40w cycle...

Completed 40w cycle high at week 36, in the upper range of the time band, but still average length which is 32-36 weeks.
Now we should see move lower into 40w cycle low. If it has average length the low should be late March/early April.
Maybe we will see 40w cycle, which visualy divides in three... like this

Dec 15, 2024
Weekly preview
Still waiting for confirmation of a completed pattern. DJ/NYSE/SPXEW are declining for two weeks and it looks like reversal, but NDX helps the SPX to stay around the highs.
Short term we still could see wave b/2 for DJ/NYSE/SPXEW and wave 5/c of a diagonal for SPX.
Intermediate term the indices are at a high which will result in several months correction - shown below on the DJ chart, SPX is the same I just have DJ chart with anotations.
TRADING
Trading trigger - neutral signal.
Analysis - long term important top it could be 4y cycle high. Intermediate term at 40w cycle high.
P.S. - for a trade both analysis and trigger should point in the same direction.
TECHNICAL PICTURE and ELLIOTT WAVES
Short term - completed w-x-y and b/2 now, or a-b-c and waiting for 5/c.
Intermediate term - regular tops for 40w high followed by roughly 3 months correction and 40w low. The size of the correction will show if we have completed w-x-y from 2022 or something else.
Long term - double zig-zag(from 2020) for y/B at 9y cycle high 2000-2007-2015-2024.
MARKET BREADTH INDICATORS
Market Breadth Indicators - turned lower and divergences.
McClellan Oscillator - below zero.
McClellan Summation Index - sell signal.
Weekly Stochastic of the Summation Index - buy signal.
Bullish Percentage - moving lower.
Percent of Stocks above MA50 - moving lower.
Advance-Decline Issues - moving lower.
Fear Indicator VIX - divergences.
HURST CYCLES
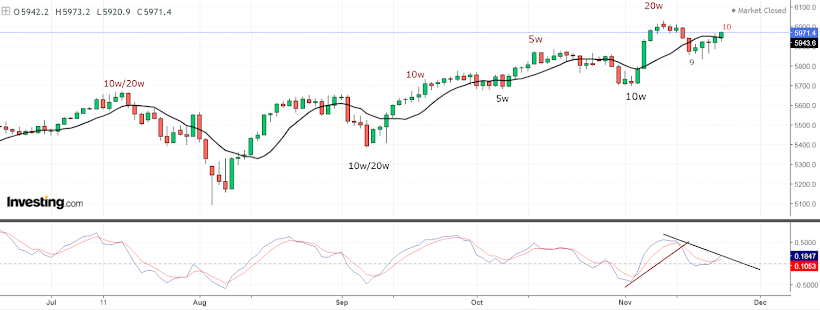
Short term cycles - 5w/20w/40w high or not waiting for confirmation. The lows - either short 20w cycle or longer 10w cycle... the the 5w cycle looks longer too... not very clear picture.

Week 36+1 for the 40w high - in the upper range of the time band which is average 32-36 weeks.

Trading trigger - neutral signal.
Analysis - long term important top it could be 4y cycle high. Intermediate term at 40w cycle high.
P.S. - for a trade both analysis and trigger should point in the same direction.

TECHNICAL PICTURE and ELLIOTT WAVES
Short term - completed w-x-y and b/2 now, or a-b-c and waiting for 5/c.

Intermediate term - regular tops for 40w high followed by roughly 3 months correction and 40w low. The size of the correction will show if we have completed w-x-y from 2022 or something else.

Long term - double zig-zag(from 2020) for y/B at 9y cycle high 2000-2007-2015-2024.

MARKET BREADTH INDICATORS
Market Breadth Indicators - turned lower and divergences.
McClellan Oscillator - below zero.
McClellan Summation Index - sell signal.
Weekly Stochastic of the Summation Index - buy signal.
Bullish Percentage - moving lower.
Percent of Stocks above MA50 - moving lower.
Advance-Decline Issues - moving lower.
Fear Indicator VIX - divergences.
HURST CYCLES
Short term cycles - 5w/20w/40w high or not waiting for confirmation. The lows - either short 20w cycle or longer 10w cycle... the the 5w cycle looks longer too... not very clear picture.

Week 36+1 for the 40w high - in the upper range of the time band which is average 32-36 weeks.

Dec 7, 2024
Weekly preview
Now we have zig-zag from the October low and double zig-zag from the August low. Now we have clear pattern from the August low at week 36 from the previous high.
This is an intermediare high 40w high, in the previous two occasions the result was 3 and 4 months correction.
TRADING
Trading trigger - buy signal.
Analysis - long term important top it could be 4y cycle high. Intermediate term at 40w cycle high.
P.S. - for a trade both analysis and trigger should point in the same direction.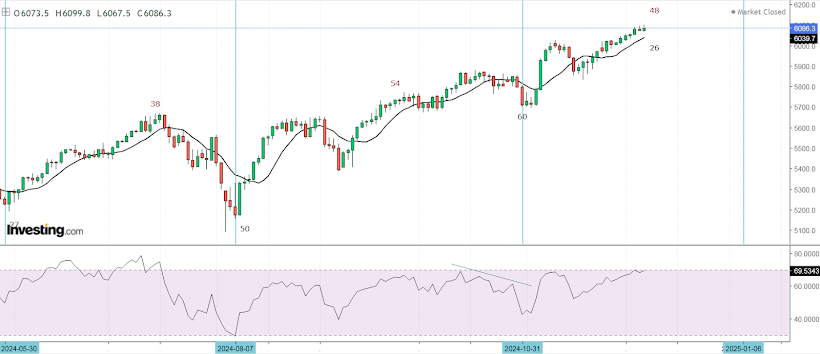
TECHNICAL PICTURE and ELLIOTT WAVES
Short term - now we have the usual double zig-zag.
Intermediate term - complex wave Y... and now we have completed pattern for y/Y as always another double zig-zag.
Long term - double zig-zag(from 2020) for y/B at 9y cycle high 2000-2007-2015-2024.
MARKET BREADTH INDICATORS
Market Breadth Indicators - weakness and divergences, but no turn lower so far.
McClellan Oscillator - around zero.
McClellan Summation Index - buy signal with divergence.
Weekly Stochastic of the Summation Index - buy signal.
Bullish Percentage - around 70 with divergence.
Percent of Stocks above MA50 - turned lower with divergence.
Advance-Decline Issues - divergence.
Fear Indicator VIX - divergence.
HURST CYCLES
Short term cycles - at 5w high next is turn lower into 5w low. This should be 20w/40w high.

Week 36 for the 40w high - in the upper range of the time band which is average 32-36 weeks.

Trading trigger - buy signal.
Analysis - long term important top it could be 4y cycle high. Intermediate term at 40w cycle high.
P.S. - for a trade both analysis and trigger should point in the same direction.

TECHNICAL PICTURE and ELLIOTT WAVES
Short term - now we have the usual double zig-zag.

Intermediate term - complex wave Y... and now we have completed pattern for y/Y as always another double zig-zag.

Long term - double zig-zag(from 2020) for y/B at 9y cycle high 2000-2007-2015-2024.

MARKET BREADTH INDICATORS
Market Breadth Indicators - weakness and divergences, but no turn lower so far.
McClellan Oscillator - around zero.
McClellan Summation Index - buy signal with divergence.
Weekly Stochastic of the Summation Index - buy signal.
Bullish Percentage - around 70 with divergence.
Percent of Stocks above MA50 - turned lower with divergence.
Advance-Decline Issues - divergence.
Fear Indicator VIX - divergence.
HURST CYCLES
Short term cycles - at 5w high next is turn lower into 5w low. This should be 20w/40w high.

Week 36 for the 40w high - in the upper range of the time band which is average 32-36 weeks.

Dec 2, 2024
Update
Holiday in the USA and the indices has not really moved... so just a quick update how completed pattern could look like.
a-b-c with c-wave diagonal.
 The usual double zig-zag


Nov 23, 2024
Weekly preview
This week looks like corrective leg for 20d high and another leg lower should follow. NDX weak, DJ strong and SPX somewhere in the middle...
Intermediate term still waiting for more clarity with the strange looking pattern from the August low
TRADING
Trading trigger - buy signal.
Analysis - long term important top it could be 4y cycle high. Intermediate term at 40w cycle high.
P.S. - for a trade both analysis and trigger should point in the same direction.
TECHNICAL PICTURE and ELLIOTT WAVES
Short term - questionable impulse lower... so far most likely a-b with c to follow.
Intermediate term - complex wave Y... waiting for confirmation if this is the top.
Long term - double zig-zag(from 2020) for y/B at 9y cycle high 2000-2007-2015-2024.
MARKET BREADTH INDICATORS
Market Breadth Indicators - oscillators turned higher, but overall negative with divergences.
McClellan Oscillator - above zero.
McClellan Summation Index - sell signal.
Weekly Stochastic of the Summation Index - sell signal.
Bullish Percentage - heading lower and bounce higher.
Percent of Stocks above MA50 - heading lower and bounce higher.
Advance-Decline Issues - in the middle of the range.
Fear Indicator VIX - divergence.
HURST CYCLES
Short term cycles - at 20d high, next is decline into 20d/5w low.
Week 32+2 for the 40w high - in the time band for a high, maybe we saw it already.

Trading trigger - buy signal.
Analysis - long term important top it could be 4y cycle high. Intermediate term at 40w cycle high.
P.S. - for a trade both analysis and trigger should point in the same direction.

TECHNICAL PICTURE and ELLIOTT WAVES
Short term - questionable impulse lower... so far most likely a-b with c to follow.

Intermediate term - complex wave Y... waiting for confirmation if this is the top.

Long term - double zig-zag(from 2020) for y/B at 9y cycle high 2000-2007-2015-2024.

MARKET BREADTH INDICATORS
Market Breadth Indicators - oscillators turned higher, but overall negative with divergences.
McClellan Oscillator - above zero.
McClellan Summation Index - sell signal.
Weekly Stochastic of the Summation Index - sell signal.
Bullish Percentage - heading lower and bounce higher.
Percent of Stocks above MA50 - heading lower and bounce higher.
Advance-Decline Issues - in the middle of the range.
Fear Indicator VIX - divergence.
HURST CYCLES
Short term cycles - at 20d high, next is decline into 20d/5w low.

Week 32+2 for the 40w high - in the time band for a high, maybe we saw it already.

Nov 16, 2024
Weekly preview
Deep decline... illusionary strength not a surprise at all the markets are topping. Best case some topping pattern like ED, but so late in the cycle week 33 for the 40w cycle high I am rather sceptical.... more likely we have reversal from 40w high.As I wrote last week quick look at the weekly indicators shows this is final move not a beginning and this week proved it... a lot of excitement for nothing.
TRADING
Trading trigger - sell signal.
Analysis - long term important top it could be 4y cycle high. Intermediate term at 40w cycle high.
P.S. - for a trade both analysis and trigger should point in the same direction.
TECHNICAL PICTURE and ELLIOTT WAVES
Short term - it could be impulse with extended third wave 2.168, but we need to see waves 4 and 5. The pattern from the August low is very odd and it is difficult to say what exatcly we have.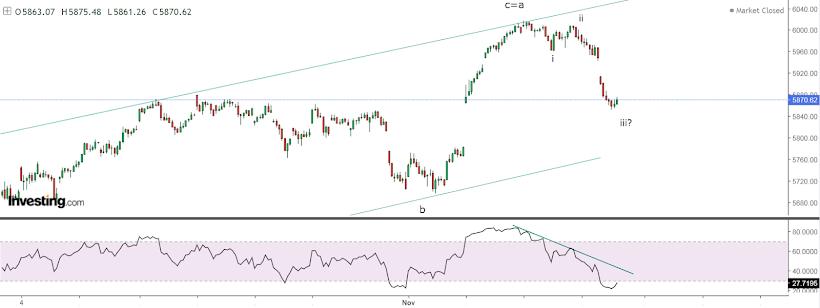
Intermediate term - complex wave Y... waiting for more clarity if this is the top.
Long term - double zig-zag(from 2020) for y/B at 9y cycle high 2000-2007-2015-2024.
MARKET BREADTH INDICATORS
Market Breadth Indicators - turned lower with divergences.
McClellan Oscillator - below zero.
McClellan Summation Index - sell signal.
Weekly Stochastic of the Summation Index - sell signal.
Bullish Percentage - turned lower with divergence.
Percent of Stocks above MA50 - turned lower with divergence.
Advance-Decline Issues - turned lower with divergence.
Fear Indicator VIX - turned higher and divergence.
HURST CYCLES
Short term cycles - close to 20d low and next 20d high... maybe we saw the 20w high already.
The ugly pattern does not help to pin 10w cycle high/low with conviction... I have the feeling two weeks ago we had 10w low.
Week 32+1 for the 40w high - in the time band for a high.

Trading trigger - sell signal.
Analysis - long term important top it could be 4y cycle high. Intermediate term at 40w cycle high.
P.S. - for a trade both analysis and trigger should point in the same direction.

TECHNICAL PICTURE and ELLIOTT WAVES
Short term - it could be impulse with extended third wave 2.168, but we need to see waves 4 and 5. The pattern from the August low is very odd and it is difficult to say what exatcly we have.

Intermediate term - complex wave Y... waiting for more clarity if this is the top.
Long term - double zig-zag(from 2020) for y/B at 9y cycle high 2000-2007-2015-2024.

MARKET BREADTH INDICATORS
Market Breadth Indicators - turned lower with divergences.
McClellan Oscillator - below zero.
McClellan Summation Index - sell signal.
Weekly Stochastic of the Summation Index - sell signal.
Bullish Percentage - turned lower with divergence.
Percent of Stocks above MA50 - turned lower with divergence.
Advance-Decline Issues - turned lower with divergence.
Fear Indicator VIX - turned higher and divergence.
HURST CYCLES
Short term cycles - close to 20d low and next 20d high... maybe we saw the 20w high already.
The ugly pattern does not help to pin 10w cycle high/low with conviction... I have the feeling two weeks ago we had 10w low.

Week 32+1 for the 40w high - in the time band for a high.

Nov 10, 2024
Weekly preview
A lot of excitement.... at the top. The big picture has not changed at all - we have another zig-zag(majority count impulse) completing bigger double zig-zag from the 10.2023 low and even bigger double zig-zag from the 10.2022 low at week 32 for the 40w cycle high(rigth on time), with daily/weekly/monthly divergence.
Short said nothing changed.... in fact there is one difference - now we have market breadth divergences the final missing ingredient from the list above.I have added DJT charts to see crystal clear the pattern - three double zig-zags from different degrees most likely c/Y/B... all this heavily skewed by tech stock leading to very choppy/complex pattern y-wave for the SPX, but still the same.
TRADING
Trading trigger - buy signal.
Analysis - long term important top it could be 4y cycle high. Intermediate term at 40w cycle high.
P.S. - for a trade both analysis and trigger should point in the same direction.
TECHNICAL PICTURE and ELLIOTT WAVES
Short term - another shitty impulse.... which is not an impulse. I would say zig-zags as usual in the last several years. For the leg from this week impulse can be counted according to RSI.
Intermediate term - complex wave Y caused by tech stocks. Either this version of a zig-zag or the one from the previous chart and triangle like NDX. Very consistent cycle highs at wave/pattern highs the next one is due - this is not a beginning it is an end. Complex - NDX most likely triangle X-wave and the final zig-zag
 Simple - DJT clear double zig-zag for the c-wave no confusion about impulse. The higher degree the Y-wave no new high in August, no triangle just clear double zig-zag.

Long term - double zig-zag(from 2020) for y/B at 9y cycle high 2000-2007-2015-2024. DJT weekly the whole double zig-zag from 2022. It looks to me like B-wave for a flat correction... I will not be surprised to see sharp decline C-wave and 54month cycle low from a 9y cycle according to the Hurst theory.

MARKET BREADTH INDICATORS
Market Breadth Indicators - oscillators turned higher, but not even close to the previous high... probably divergences.
McClellan Oscillator - sligthly above zero with multiple divergences.
McClellan Summation Index - sell signal.
Weekly Stochastic of the Summation Index - sell signal.
Bullish Percentage - turned up, most likely divergence.
Percent of Stocks above MA50 - turned up, most likely divergence.
Advance-Decline Issues - turned up, most likely divergence.
Fear Indicator VIX - moving lower and divergence.
HURST CYCLES
Short term cycles - waiting for the completition of 20d/5w/20w/40w cycle high.

Week 32 for the 40w high - in the time band for a high.

Trading trigger - buy signal.
Analysis - long term important top it could be 4y cycle high. Intermediate term at 40w cycle high.
P.S. - for a trade both analysis and trigger should point in the same direction.

TECHNICAL PICTURE and ELLIOTT WAVES
Short term - another shitty impulse.... which is not an impulse. I would say zig-zags as usual in the last several years. For the leg from this week impulse can be counted according to RSI.

Intermediate term - complex wave Y caused by tech stocks. Either this version of a zig-zag or the one from the previous chart and triangle like NDX. Very consistent cycle highs at wave/pattern highs the next one is due - this is not a beginning it is an end.


Long term - double zig-zag(from 2020) for y/B at 9y cycle high 2000-2007-2015-2024.


MARKET BREADTH INDICATORS
Market Breadth Indicators - oscillators turned higher, but not even close to the previous high... probably divergences.
McClellan Oscillator - sligthly above zero with multiple divergences.
McClellan Summation Index - sell signal.
Weekly Stochastic of the Summation Index - sell signal.
Bullish Percentage - turned up, most likely divergence.
Percent of Stocks above MA50 - turned up, most likely divergence.
Advance-Decline Issues - turned up, most likely divergence.
Fear Indicator VIX - moving lower and divergence.
HURST CYCLES
Short term cycles - waiting for the completition of 20d/5w/20w/40w cycle high.

Week 32 for the 40w high - in the time band for a high.

Nov 3, 2024
Weekly preview
The October gains wiped out in one day. The high was in mid-October well visible if you look at DJ/NYSE and again tech strength masking it.
Next week we should see a low(5w low) then higher into mid-November(5w high), lower low early December(20w low) then higher for the holidays(20w high). This is what the cycles are showing.
From the 2022 low we have a double zig-zag completed - well visible if you look at DJ/NYSE. From cycle perspective one 40w cycle is missing for 4y cycle high..... the next few months will confirm or not if this is THE top.
TRADING
Trading trigger - sell signal.
Analysis - long term important 4y cycle high. Intermediate term 40w cycle high and lower into 40w cycle low.
P.S. - for a trade both analysis and trigger should point in the same direction.
TECHNICAL PICTURE and ELLIOTT WAVES
Short term - so far a-b-c or 1-2-3 lower, too early to make conclusions.
Intermediate term - the Y-wave should be completed. According to cycles this is the path(NOT SIZE) we should see until the end of the year.
Long term - double zig-zag(from 2020) for y/B at 9y cycle high 2000-2007-2015-2024.
MARKET BREADTH INDICATORS
Market Breadth Indicators - moving lower, no oversold levels so far.
McClellan Oscillator - deep below zero.
McClellan Summation Index - sell signal.
Weekly Stochastic of the Summation Index - sell signal.
Bullish Percentage - moving lower.
Percent of Stocks above MA50 - moving lower.
Advance-Decline Issues - moving lower.
Fear Indicator VIX - moving higher.
HURST CYCLES
Short term cycles - next week we should see 20d/5w cycle low then higher into 5w around mid-November.

With two red weeks in a row the 40w high should be in. Next we should see 4-5 weeks lower and 20w cycle low.

Trading trigger - sell signal.
Analysis - long term important 4y cycle high. Intermediate term 40w cycle high and lower into 40w cycle low.
P.S. - for a trade both analysis and trigger should point in the same direction.

TECHNICAL PICTURE and ELLIOTT WAVES
Short term - so far a-b-c or 1-2-3 lower, too early to make conclusions.

Intermediate term - the Y-wave should be completed. According to cycles this is the path(NOT SIZE) we should see until the end of the year.

Long term - double zig-zag(from 2020) for y/B at 9y cycle high 2000-2007-2015-2024.

MARKET BREADTH INDICATORS
Market Breadth Indicators - moving lower, no oversold levels so far.
McClellan Oscillator - deep below zero.
McClellan Summation Index - sell signal.
Weekly Stochastic of the Summation Index - sell signal.
Bullish Percentage - moving lower.
Percent of Stocks above MA50 - moving lower.
Advance-Decline Issues - moving lower.
Fear Indicator VIX - moving higher.
HURST CYCLES
Short term cycles - next week we should see 20d/5w cycle low then higher into 5w around mid-November.
With two red weeks in a row the 40w high should be in. Next we should see 4-5 weeks lower and 20w cycle low.

Oct 19, 2024
Weekly preview
More price action in the wedge.... so nothing new, pattern and cycles getting ripe a few more days.
TRADING
Trading trigger - buy signal.
Analysis - long term topping process for important high 4y cycle high. Intermediate term higher into 40w cycle high.
P.S. - for a trade both analysis and trigger should point in the same direction.
TECHNICAL PICTURE and ELLIOTT WAVES
Short term - it can be a-b-c with the c-wave as a wedge. Maybe a few days to complete the wedge... according to cycles.
Intermediate term - it looks like complex pattern for the Y-wave.
Long term - double zig-zag(from 2020) for y/B at 9y cycle high 2000-2007-2015-2024.
MARKET BREADTH INDICATORS
Market Breadth Indicators - mixed signals.
McClellan Oscillator - around zero.
McClellan Summation Index - sell signal.
Weekly Stochastic of the Summation Index - sell signal.
Bullish Percentage - short term divergence.
Percent of Stocks above MA50 - short term divergence.
Advance-Decline Issues - in the midlle of the range.
Fear Indicator VIX - turned lower... in a range.
HURST CYCLES
Short term cycles - it looks like three shorter 20d cycles for the 5w cycle high to complete 20w/40w cycle high.

Higher into 40w high the fifth one for the current 4y cycle high. Week 14 for the 20w cycle and 29 for the 40w cycle - close to completion.

Trading trigger - buy signal.
Analysis - long term topping process for important high 4y cycle high. Intermediate term higher into 40w cycle high.
P.S. - for a trade both analysis and trigger should point in the same direction.

TECHNICAL PICTURE and ELLIOTT WAVES
Short term - it can be a-b-c with the c-wave as a wedge. Maybe a few days to complete the wedge... according to cycles.

Intermediate term - it looks like complex pattern for the Y-wave.

Long term - double zig-zag(from 2020) for y/B at 9y cycle high 2000-2007-2015-2024.

MARKET BREADTH INDICATORS
Market Breadth Indicators - mixed signals.
McClellan Oscillator - around zero.
McClellan Summation Index - sell signal.
Weekly Stochastic of the Summation Index - sell signal.
Bullish Percentage - short term divergence.
Percent of Stocks above MA50 - short term divergence.
Advance-Decline Issues - in the midlle of the range.
Fear Indicator VIX - turned lower... in a range.
HURST CYCLES
Short term cycles - it looks like three shorter 20d cycles for the 5w cycle high to complete 20w/40w cycle high.

Higher into 40w high the fifth one for the current 4y cycle high. Week 14 for the 20w cycle and 29 for the 40w cycle - close to completion.

Subscribe to:
Posts (Atom)