Trading trigger - buy signal.
Analysis - at the top. Important turn lower - waiting for confirmation next week.
P.S. - for a trade both analysis and trigger should point in the same direction.

TECHNICAL PICTURE and ELLIOTT WAVES
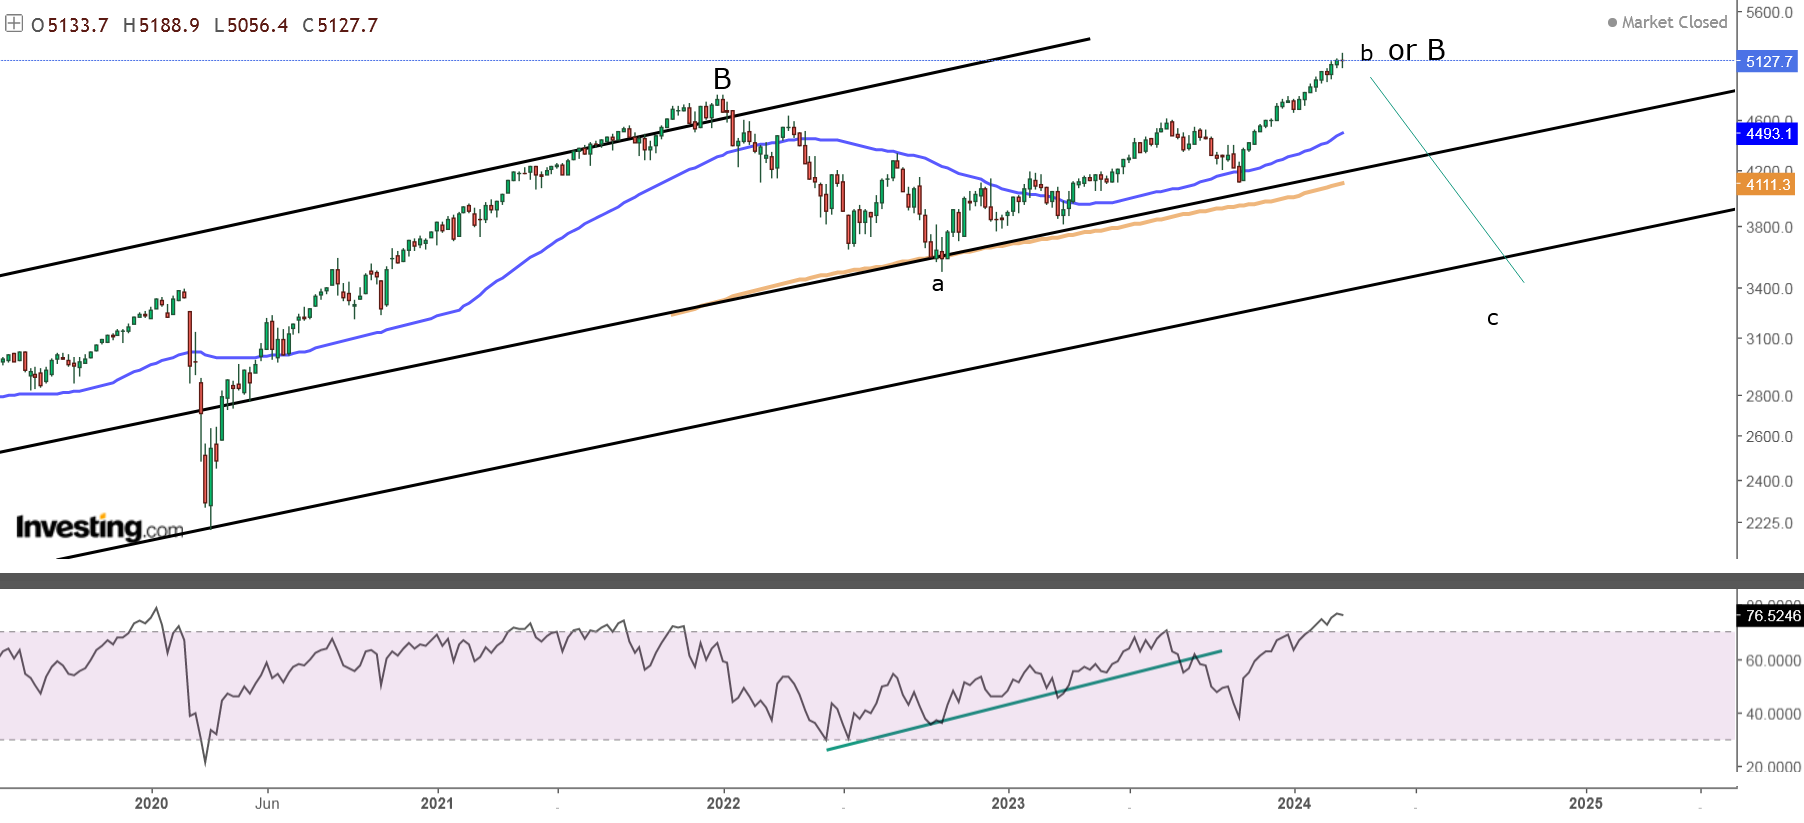
Short term - looks like corrective w-x-y with plenty of zig-zags... difficult to see impulse.

Intermediate term - two double zig-zags for w-x-y at two Fibo targets. This should be the top of corrective B-wave and C-wave for a flat should follow. Alternate this is a-b-c from the 2020 low and the top from 2009.

Long term - 4y cycle high the end of 2021, now a-b-c lower, alternate this is the top from 2009.
MARKET BREADTH INDICATORS
Market Breadth Indicators - weak with divergences.
McClellan Oscillator - above zero, multiple divergences.
McClellan Summation Index - very weak buy signal.
Weekly Stochastic of the Summation Index - buy signal.
Bullish Percentage - divergence.
Percent of Stocks above MA50 - divergence.
Advance-Decline Issues - multiple divergences.
Fear Indicator VIX - multiple divergences.
HURST CYCLES
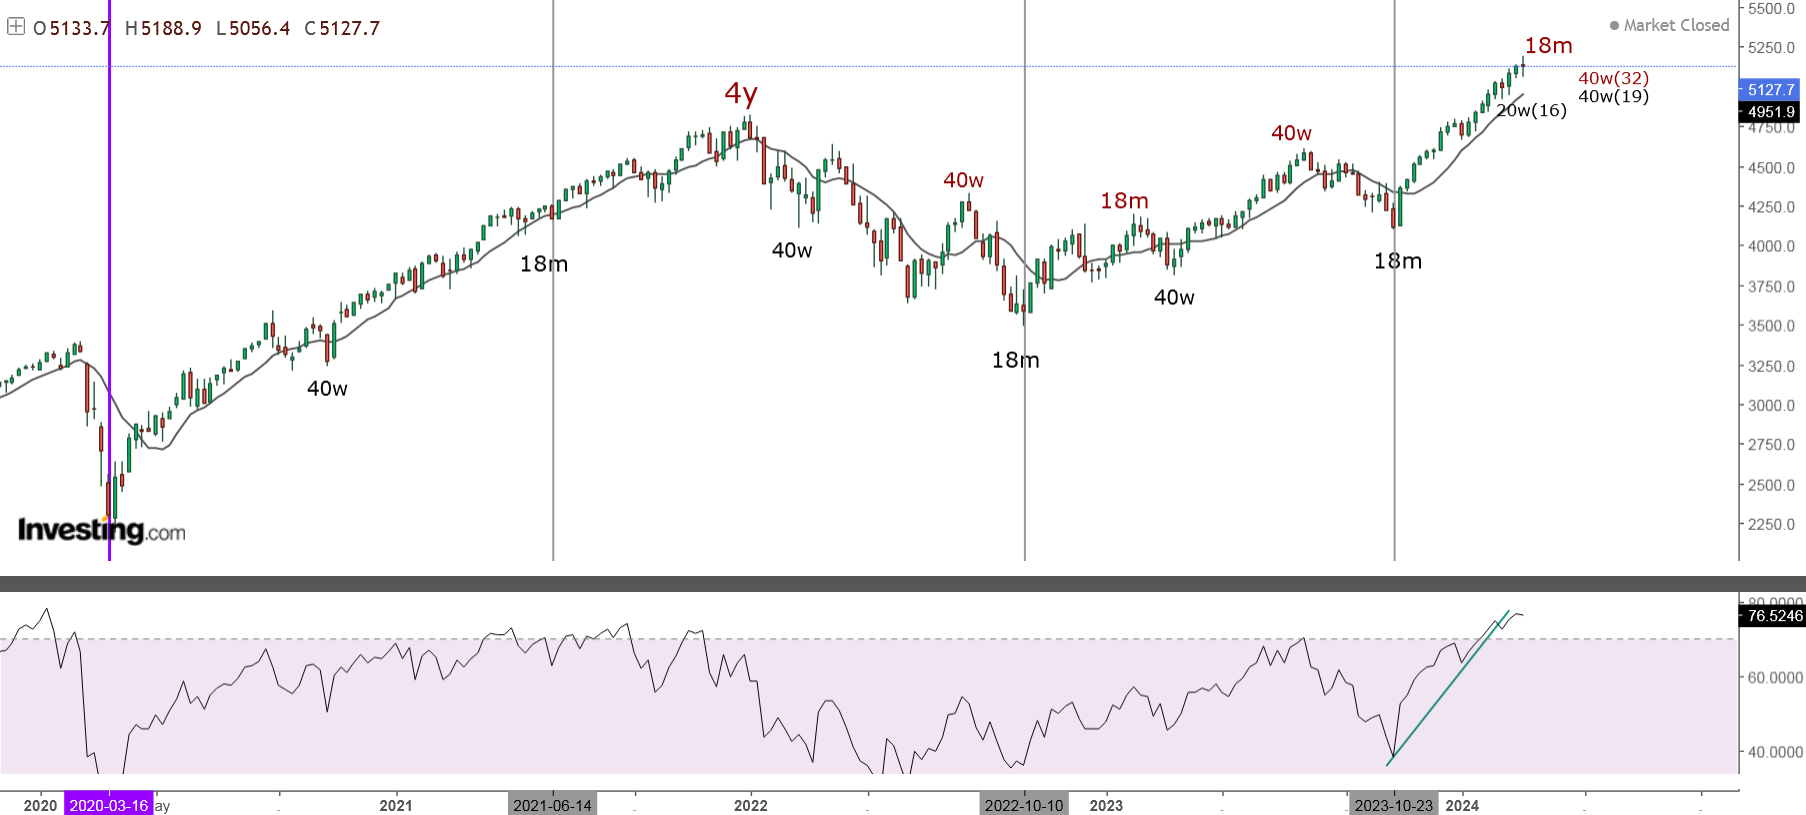
Short term cycles - choppy moves makes it difficult to count shorter cycles. The highs look like three extended 10w cycles, 5w cycle high in the middle and three 20d cycles to complete 5w/10w/40w cycle high.
The lows - sticking to the theory 20w low in February, but vusualy probably three extended 10w cycles too.

Week 19 for the 40w cycle. Probably 40w cycle consisting of three extended 10w cycles, but if I have to pinpoint 20w low it should be at week 16.
Week 32 high-to-high, at the top of at least 40w cycle... and very likely 18m cycle high too.
Average length for the 40w cycle is 32-36 weeks the last 40w low was 33 weeks long and now the high is 32 weeks long maybe the market is back to normal rhythm after shorter cycles from mid-2022 to mid-2023.
What indicator do you look at to confirm potential reversal? Daily close below MA10?
ReplyDeleteEarly trigger is when the 20d cycle turns lower - close below the open of the previous day means with high probability the 20d cycle turned lower. This should occur early in the cycle after several days for some kind of reversal... at least 5w cycle or longer turned lower.
DeleteAnother trigger - two closes below MA10 usually means the 10w cycle or longer turned low.
Of course the context of the bigger picture is important - for example if triggered at week 13 expect a few weeks lower for 20w low, at week 32 from the previous high like now with high probability 40w high.
Thank you for a detailed response.
DeleteBtw curious to know your thoughts on real estate market in the US. Do you think it's headed lower over the longer term?
I do not have information I can only speculate - when the bust comes many assets will be put on the table for sale so probably overshoot lower for a short period 1-2-3 years... then normalization.
DeleteThe era of financialization should come to an end and after that normal market - supply and demand without speculation.
2030-2040 commodities should be higher so it will not be cheap to build a new house.
I lived the 2000's Bubble and seems repeat another time. Too much foolishness,price with no justification.
ReplyDeleteThere is a whole new generation which is conditioned that declines does not matter it's always higher, they are interested to get rich for a day without effort. If you think stocks are crazy the crypto world is insane chasing the next altcoin to jump 100 times.
DeleteWaaaay to much greed, this will end as always - in tears.
Yes i agree,do you think also Bitcoin at 70000$ It Is ready for the downside?
ReplyDeleteThere is two zig-zags higher so the pattern looks complete.
DeleteThis market is headed for another leg higher. Likely another 10-20% higher before correction begins.
DeletePerhaps another higher high on the short term chart? 50-60 handles or so
ReplyDeleteSo choppy no idea if this is triangle, ED or just zig-zag.
DeleteDon’t be calling tops on a market that breaks all time highs. It can keep going for a long time. Read the turtle trader.
DeleteDaily S&P hasn't dropped at least 2% in 265 days now, the most since 2018 ...
ReplyDeleteMy target from the chart Krasi mentioned in the post is bit higher at 5221 where a=c, where I'll be waiting for confirmed reversal, if not then revise the plan
ReplyDeleteOne more touch of the upper trend line will complete impulse and zig-zag c/y - https://invst.ly/13zixo
DeleteKind of, I also use some of the indicators you list every week and imho this one is most important to confirm when reversal is likely https://stockcharts.com/h-sc/ui?s=%21MCSUMRSPX&p=W&yr=2&mn=0&dy=0&id=p03323205892
Delete