May 26, 2019

Weekly preview

Selling this week... SPX holding above 2800, but other indexes made lower low. I do not see signs for a third wave and waterfall.
The same thoughts like last week - example sectors like banking and semis with clear impulse lower which is finishing(SOX with extended fifth wave) and retracement expected, cycles and indicators suggesting something higher etc.
All this means on one side huge decline in a third wave is unlikely, on the other side simple correction and another long lasting rally is unlikely too.
I expect the SP500 to make lower low in sync with the rest of the indexes.... quick move lower to test MA200 and reversal higher next week. Most of June should be positive - different shares and indexes need to retrace for a few weeks plus 20 week cycle low expected so the next one even bearish should move 3-4-5 weeks higher.


TECHNICAL PICTURE and ELLIOTT WAVES
Short term - it is looking like a zig-zag to test MA200 daily.


Intermediate term - looking at the histogram and RSI divergences are building and we should see something higher. Can the SP500 make a higher high when other indexes make a lower high... I do not know, the pattern is difficult. I will just wait to see how the move in June develops.
From the last low in March we have three up and now most likely three down - the options are we have a top and the count is ugly w-x-y or ED is running. Green the ED will need higher high, yellow is the path with zig-zags lower.
The price is trapped between MA50 and MA200 and should spend some time between them. If we have reversal this is the usual path around the MAs - break below it, test, another sell off.


Long term - one more leg lower to finish wave IV from 2009. If the decline already begun, zig-zag will fit better both time and pattern. .
I am not sure how to count this w1, but this is the alternative.


MARKET BREADTH INDICATORS
Market Breadth Indicators - still in sell mode, but looking the McClellan Oscillator for example we should see at least something higher for a few weeks.
McClellan Oscillator - six weeks below zero, this is more like some kind of a bottom and not sell off is just starting.
McClellan Summation Index - sell signal.
Weekly Stochastic of the Summation Index - sell signal in oversold territory.
Bullish Percentage - pointing lower.
Percent of Stocks above MA50 - in the middle of the range.
Fear Indicator VIX - one more low expected.
Advance-Decline Issues - in the middle of the range.


HURST CYCLES
Day 44+9, waiting for confirmation if we have daily cycle low.


Week 22 waiting for confirmation that we have 20 week cycle low.

May 19, 2019

Weekly preview

It looks like impulse lower and many are counting reversal.... with sharp third wave around the corner. Looking at different indexes,stocks, indicators and market breadth it is unlikely. It is a mixed picture I can not see neither strong bullish nor bearish case. If we have major reversal why DAX/RUT declined with a zig-zag? SOX/EEM close to finishing an impulse lower and retracement expected not third wave. BA has more to the downside but it should retrace first, or INTC it plunged but it should retrace first before continuing lower, or MSFT 11% from NDX it looks like wave i/5 for the missing final fifth.... there is many more examples. Market breadth - McClellan Oscillator below zero fo a month this is consistent with correction finishing not beginning. Cycles we should expect daily cycle low and 20 week cycle low.

What is the message from all that above? The extremes are not very likely. Bullish extreme the next leg higher begun is unlikely when some stocks/indexes reversed and other need final push higher to finish the pattern. Bearish extreme we have reversal and 1-2 with 3 coming next week 200 points lower does not look likely either when the stocks which reversed should retrace next or some are not done to the upside.

So what are the options - slightly bigger, but still wave 4 from ED shown last week or we have a reversal, but with zig-zag. I was showing on the weekly chart a zig-zag, which fits better because of time, inside this zig-zag wave a itself is a zig-zag(see daily chart). I prefer to see the first scenario with ED, it is always better to see clean finished pattern instead of struggling with some zig-zags.


TECHNICAL PICTURE and ELLIOTT WAVES
Short term - not sure, the move higher is corrective so which is it zig-zag higher or zig-zag lower..... no way to say until we see the next few days. If we see lower low I do not think it will be third wave more likely wave c of a bigger pattern.


Intermediate term - if we have reversal with impulse the next move is lower 200-250 points for w3(red). It should move very fast something like 2 weeks because RSI already touched 30 the oversold level and it does not really look like reversal just starting. The only way to override the message from the indicators and market breadth is waterfall decline. Looking at RSI the worst scenario I see is the circles with one more low and we are currently where the red arrow is. Usually this waterfall declines start form a higher levels - green arrows.
In green is shown the ED pattern from last week with 5=1,236x3 hitting the trend line around 2990-3000. In yellow is this zig-zag story.


Long term - one more leg lower to finish wave IV from 2009. If the decline already begun, zig-zag will fit better both time and pattern. If we see one more high decline in C wave impulse will look good - because of possible expanded flat B=1,236xA(see daily chart) and it will push the high a few weeks later.
I am not sure how to count this w1, but this is the alternative.


MARKET BREADTH INDICATORS
Market Breadth Indicators - signaling that the indexes are nearing intermediate term low, but no way to say one more low or not.
McClellan Oscillator - below zero for a long time.
McClellan Summation Index - sell signal.
Weekly Stochastic of the Summation Index - sell signal in oversold territory.
Bullish Percentage - pointing lower.
Percent of Stocks above MA50 - in the middle of the range.
Fear Indicator VIX - nervous markets one more lower possible so one more push higher.
Advance-Decline Issues - in the middle of the range.


HURST CYCLES
Day 44+4 close to a daily cycle low or already behind us.


Week 21, as I wrote last week my indicators are telling me this is 20 week cycle low.

May 11, 2019

Weekly preview

Lower as expected, but something different than this w4 from last week. On Monday I warned that something else is going on. Why, it was the perfect looking w4? - TIME. Cycles turning lower and expected decline for at least 1-2 weeks.
Now we have set of 9 waves for impulse around 2830 (one low at 2835 and one at 2825:) but it does not feel bearish.... maybe "a" for a-b-c but that is all. This decline does not feel convincing:
- for important reversal I want to see clean impulse lower closing near the low for the week printing bearish weekly candle - none of this happened.
- on the daily chart we have two failed attempts to move below MA50 and two bullish reversal candles.
- McClellan Oscillator and VIX telling me this is a low and not the start of a big decline.
- I see now two daily cycles and the indicators telling me this is 20 week cycle low.
- I can not see finished pattern to the upside one more high is needed.

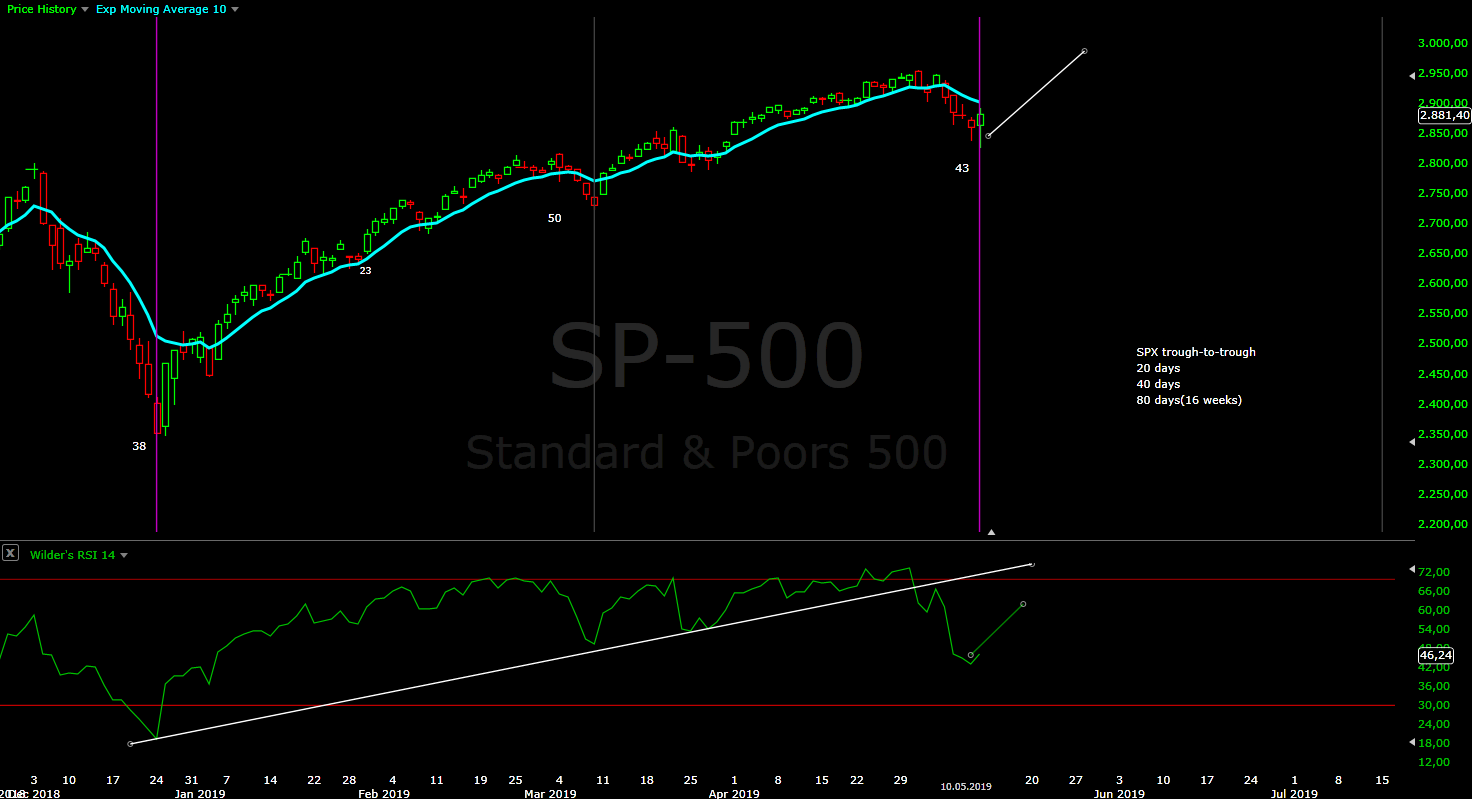
To sum it up my intuition tells me there is no reversal, this is 20 week cycle and we will see one more leg up 4 weeks to around 3030 to finish ED.


TECHNICAL PICTURE and ELLIOTT WAVES
Short term - it looks like impulse, but something does not feel right. Now 2900-2920 is resistance zone. I see impulse testing it, next we should see zig-zag lower to confirm the indexes turned up and move above this resistance zone.


Intermediate term - choppy pattern again overlapping with previous highs, I am not 100% sure where wave b is, but in both cases it is pointing to the same outcome and pattern just the Fibo levels are slightly different.
If you measure the waves 3=1.236x1(both white and red) and 4=1,618x2(white) 4=1,236x2(red). The next high is expected the first week of June and the second 20 week cycle should rally at least weeks 3-4 before it fails(again first week of June). If you draw the trend line it will be hit the first week of June around 3030. If you measure 5=1.236x3=3030(white) 5=3~3040(red).
This is what I expect - 4 weeks higher 3030-3040 to finish ED.


Long term - one more leg lower to finish wave IV from 2009 - D for triangle(zig-zag decline) or B for a flat(sharp sell off as an impulse). Decline in three waves and a low in Q1.2020 will fit better with cycles. I do not know how to count an impulse, but if I am wrong it is wave 1/V.


MARKET BREADTH INDICATORS
Market Breadth Indicators - McClellan Oscillator almost a month below zero, VIX sharp up move to 24... usually this are signs that a bottom is close and not a decline just begun.
McClellan Oscillator - below zero for several weeks.
McClellan Summation Index - sell signal with divergence.
Weekly Stochastic of the Summation Index - sell signal.
Bullish Percentage - pointing lower and below 70.
Percent of Stocks above MA50 - pointing lower in the middle of the range.
Fear Indicator VIX - too high too quickly... not sure how to interpret it. Is the sharp rally caused because of the record short VIX positions and short squeeze or we have 20 week cycle low.... maybe both. I prefer to see it testing the low with divergence before the next sell off begins.
Advance-Decline Issues - in the middle of the range.


HURST CYCLES
The 20 week cycle took the last train:))) We are seeing the second daily cycle low and most likely 20 week cycle low. In theory both the daily and weekly cycle are strong right translated and we should see another higher high. This will not break the 40 week cycle high idea, it will come later in 3-4-5 weeks and it will be still in the average length.

The biggest problem I have with cycles is to find the 20 week low... sometimes the amplitude disappears and it is difficult to find the low. First you can count two daily cycles(not always clear) - check we have it, and second I use long moving average of the McClellan Oscillator - MA50 McClellan Oscillator. You can see around the red line we have 20 week cycle low and around the blue line we have 40 week cycle low. For example 2017 was very difficult year to find lows:) it is not clear where the 18 month low is and despite that this chart works great to show you where the 20/40 week lows are. So the current message is we have 20 week cycle low - McClellan Oscillator almost a month below zero causing the MA to print this low value despite the indexes rising higher. This is how it can find hidden lows. The previous two plunges begun from a high 10-15 where the tops are and not from a low as we are currently.

Day 43, probably a daily cycle low on Friday.


Week 20... it feels like 20 week cycle low.

May 4, 2019

Weekly preview

One more touch of the upper trend line and corrective pullback running. EW - ideally this is wave 4/c/B, cycles - we have right translated cycle which should make a low in a few days and the next one should make a higher high and fail as left translated. Short said the same like in the last 4-5 weeks.


TECHNICAL PICTURE and ELLIOTT WAVES
Short term - looks like we have the ED for v/3/c. As long as the pullback stays around the 2890 area (38% retracement,trend line,support,gap,the previous wave iv) it is the perfect wave 4. Strong move on Friday, some are counting already finished w4, but it looks too short for daily cycle low.
Moving below 2870(50% retracement) and overlapping with the previous high.... means the move from the March low is over.


Intermediate term - another few days lower next week for daily cycle low and w4 followed by one more high and we will have nice clean pattern.


Long term - one more leg lower to finish wave IV from 2009 - D for triangle(zig-zag decline) or B for a flat(sharp sell off as an impulse). Decline in three waves and a low in Q1.2020 will fit better with cycles.
I do not know how to count an impulse, but if I am wrong it is wave 1/V.


MARKET BREADTH INDICATORS
Market Breadth Indicators - weakness most of the indicators with divergences, the next bigger move is lower.
McClellan Oscillator - around zero.
McClellan Summation Index - sell signal with divergence .
Weekly Stochastic of the Summation Index - sell signal.
Bullish Percentage - turned lower.
Percent of Stocks above MA50 - pointing lower with divergences.
Fear Indicator VIX - series of higher lows with divergence will look good.
Advance-Decline Issues - divergences ...


HURST CYCLES
For 20 week cycle low the time is running out... we should see sharp decline for a few weeks now. If we do not see this happen it will confirm that we have a high of 40 week cycle degree.

Day 38 - the current daily cycle turned lower. It is strong right translated and the next one should make higher high.


Week 19... I suspect stealth 20 week cycle low behind us and the coming high is of 40 week cycle degree.