Sep 30, 2013
Signals
Short term signal: DOWN - it will turn up above 1687
Intermediate term signal: DOWN - it will turn up above 1687
Comment: Push lower as expected. I think short term bottom is around the corner...
Watch price behavior for clues:
- top is in and leg down has begun - sell off continues and we see technical damages - move bellow 1670.
- a rally higher underway - not more than a pullback to support 1675-1682 and another move higher.
Levels to watch SP500:
- 1710 - resistance
- 1675-1682 - support level
- 1627 - support level
- 1598 - is major support.
Sep 28, 2013
Weekly review
Short term view - final push lower and relief rally with lower high...
Intermediate term view - lower high and intermediate term high is behind us...
Cool off as expected, the indexes are crawling down. A little bit confusing signs - DJIA very weak, Russel 2000 strong, SP500 something in the middle. Weekly chart with shooting star and red week which closed near at the lows, but on the daily chart no serious technical damages. A lot of divergences on the market breadth indicators. On the hourly chart the move looks like a wedge with expected break out on the upside, the short term cycle is bottoming...
Lets sum it up - the bigger time frames say something bad could happen but no confirmation for now, the shorter time frames say up,up...
My interpretation - the bigger time frame almost always win, which means rally ok but short term and then another move lower. How high? - DJIA is the weakest index lower high, SP500... I do not think it will make it to new highs.
TECHNICAL PICTURE
Short term - one final push lower around 1680 is 50% retracement and attempt for a rally. Bearish surprise will be if the price plunges bellow the lower wedge trend line than the target is ~1670 and 61,8% retracement.
 - Triple cross(EMA10 and EMA20 crossing EMA50) - triple cross is negative and short term trend is down.
Intermediate term - move lower to MA50, the price should find should find support short term around this levels. The scenarios stay the same like last week. We have double divergence on MACD. The bulls must consolidate the price and push higher to negate the divergence or a bigger correction will follow.
 - Trend direction EMA50/MACD - the price is above MA50 and MACD above zero the intermediate term trend is up. Watch out for the MACD double divergence.
- Momentum Histogram/RSI - momentum is pointing lower, short term trend is down.
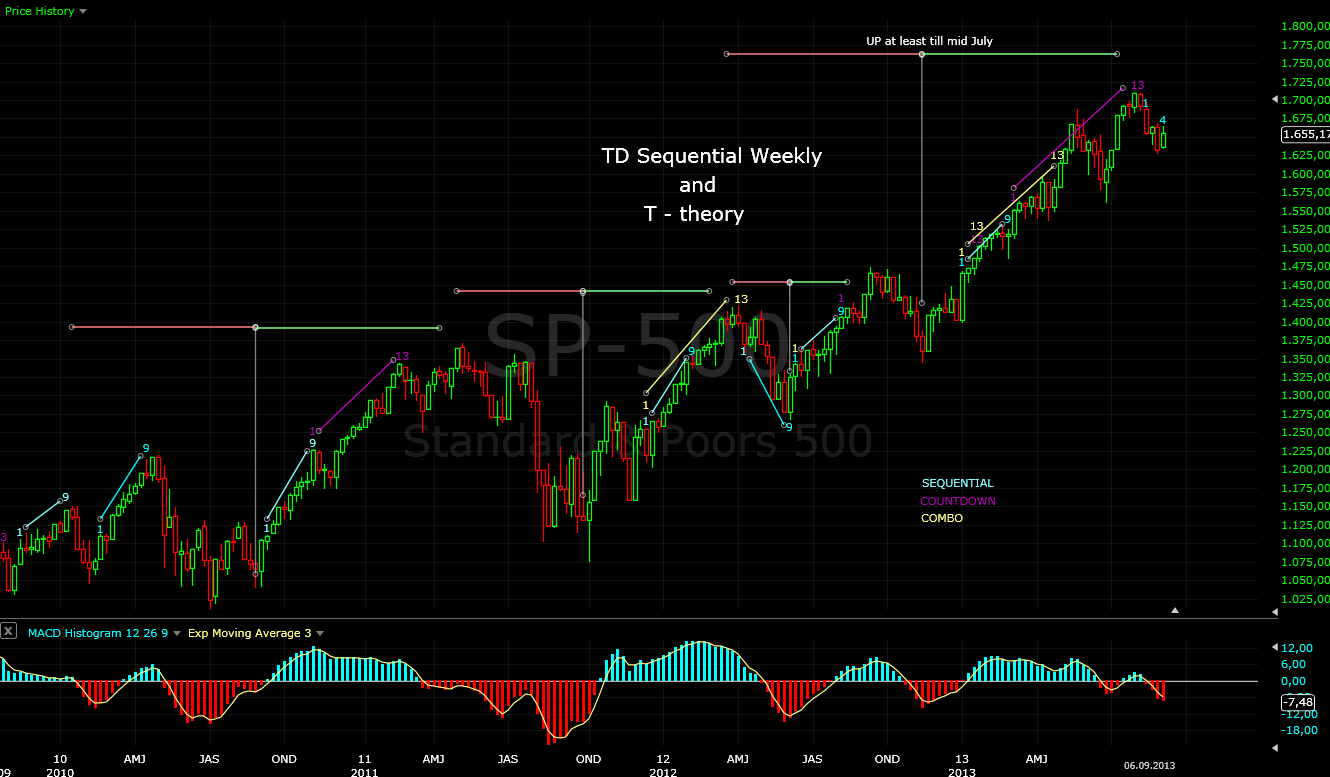
Long term - I have looked closer the histogram and it seems that it makes the same pattern as the previous tops. Based on the histogram behavior move 4 of the sequence is behind us and the last final and strongest move has started. Lets see if the pattern continue to predict the price action.
 - Trend direction EMA50/MACD - long term trend is up - the price above MA50 and MACD above zero.
- Momentum Histogram/RSI - not clear.... no useful information
MARKET BREADTH INDICATORS
The Market Breadth Indicators - the signals are still bullish, oscillators are reseting and double divergences everywhere.
McClellan Oscillator - reseting after extremes as expected
McClellan Summation Index - buy signal, but weak and way bellow previous tops... making a double divergence.
Weekly Stochastic of the Summation Index - buy signal.
Bullish Percentage - buy signal, but no "enthusiasm" at all... double divergence.
Percent of Stocks above MA50 - every rally is followed by a lower high of the indicator.
Fear Indicator VXO - higher low and divergence... bad for stocks.
Percent of Stocks above MA200 - lower high after lower high.... the internals are worsening after every rally.
Issues Declining - higher low after higher low... less stocks are moving higher, more stock are moving lower.
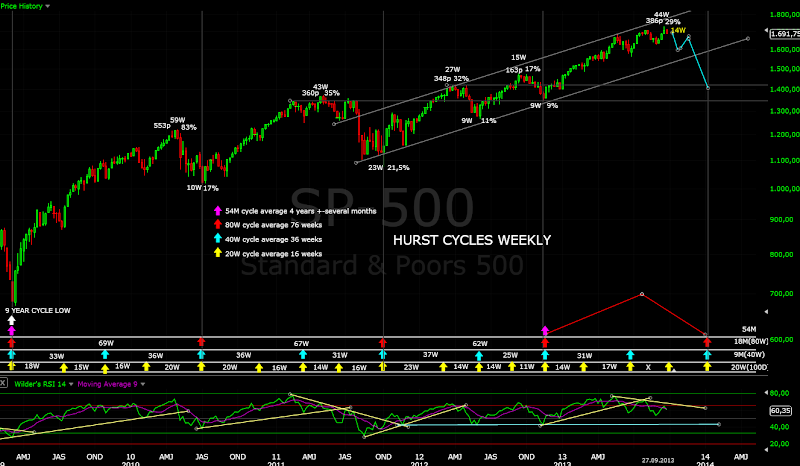
HURST CYCLES
Lets take a look at our colorful cycle chart:) - first we have 3% standard pullback after only 15 days which means the move to the upside was 10 days shorter than usual and its size is 6,4% which is less than 7% or more compared with the previous moves. Ok the last rally was shorter and with smaller size than usual which means the bigger cycles are pulling the price lower. On the other side we are at day 22 of this 40 cycle and probably we will see a short term bottom. The bulls must master strong rally to negate the signs... I am skeptical, but w will see what happens next week.

If my interpretation of the cycles is right, we should see stronger move lower in the next 2-3 weeks to finish the current 20 week cycle.
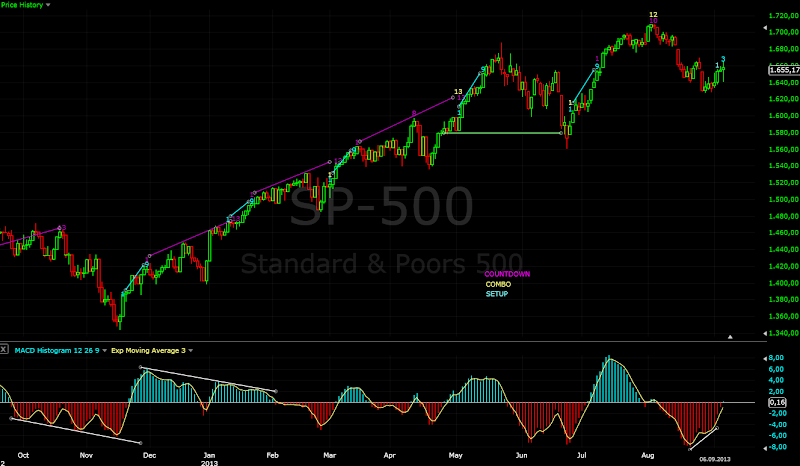
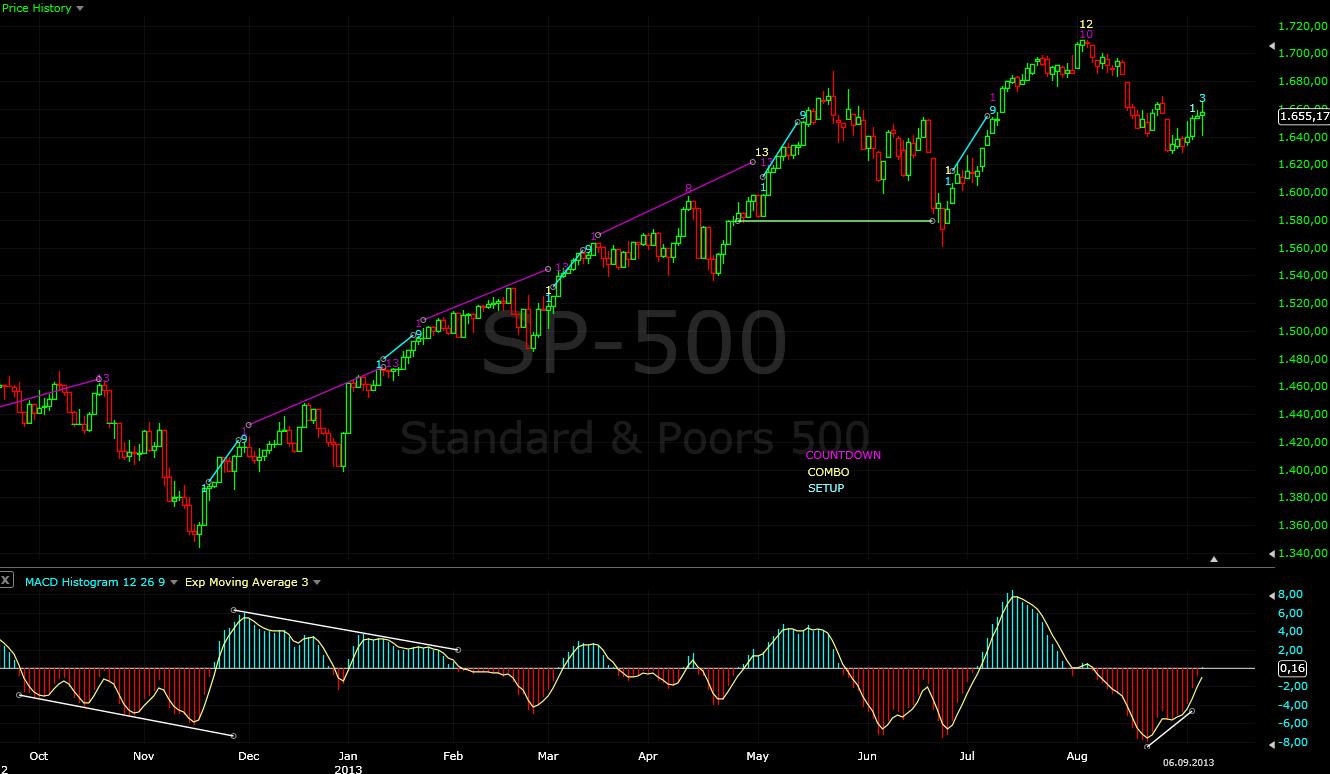
Tom Demark SEQUENTIAL AND COUNTDOWN - this technique spots areas of exhaustion.
We saw a price flip on Monday and we have currently 5 of a setup. It is difficult to say if it will finish or we will see another price flip next week.
 No price flip for now... I think we will see something similar like in the circled area - green week followed by a price flip and correction.

Intermediate term view - lower high and intermediate term high is behind us...
Cool off as expected, the indexes are crawling down. A little bit confusing signs - DJIA very weak, Russel 2000 strong, SP500 something in the middle. Weekly chart with shooting star and red week which closed near at the lows, but on the daily chart no serious technical damages. A lot of divergences on the market breadth indicators. On the hourly chart the move looks like a wedge with expected break out on the upside, the short term cycle is bottoming...
Lets sum it up - the bigger time frames say something bad could happen but no confirmation for now, the shorter time frames say up,up...
My interpretation - the bigger time frame almost always win, which means rally ok but short term and then another move lower. How high? - DJIA is the weakest index lower high, SP500... I do not think it will make it to new highs.
TECHNICAL PICTURE
Short term - one final push lower around 1680 is 50% retracement and attempt for a rally. Bearish surprise will be if the price plunges bellow the lower wedge trend line than the target is ~1670 and 61,8% retracement.

Intermediate term - move lower to MA50, the price should find should find support short term around this levels. The scenarios stay the same like last week. We have double divergence on MACD. The bulls must consolidate the price and push higher to negate the divergence or a bigger correction will follow.

- Momentum Histogram/RSI - momentum is pointing lower, short term trend is down.
Long term - I have looked closer the histogram and it seems that it makes the same pattern as the previous tops. Based on the histogram behavior move 4 of the sequence is behind us and the last final and strongest move has started. Lets see if the pattern continue to predict the price action.

- Momentum Histogram/RSI - not clear.... no useful information
MARKET BREADTH INDICATORS
The Market Breadth Indicators - the signals are still bullish, oscillators are reseting and double divergences everywhere.
McClellan Oscillator - reseting after extremes as expected
McClellan Summation Index - buy signal, but weak and way bellow previous tops... making a double divergence.
Weekly Stochastic of the Summation Index - buy signal.
Bullish Percentage - buy signal, but no "enthusiasm" at all... double divergence.
Percent of Stocks above MA50 - every rally is followed by a lower high of the indicator.
Fear Indicator VXO - higher low and divergence... bad for stocks.
Percent of Stocks above MA200 - lower high after lower high.... the internals are worsening after every rally.
Issues Declining - higher low after higher low... less stocks are moving higher, more stock are moving lower.
HURST CYCLES
Lets take a look at our colorful cycle chart:) - first we have 3% standard pullback after only 15 days which means the move to the upside was 10 days shorter than usual and its size is 6,4% which is less than 7% or more compared with the previous moves. Ok the last rally was shorter and with smaller size than usual which means the bigger cycles are pulling the price lower. On the other side we are at day 22 of this 40 cycle and probably we will see a short term bottom. The bulls must master strong rally to negate the signs... I am skeptical, but w will see what happens next week.

If my interpretation of the cycles is right, we should see stronger move lower in the next 2-3 weeks to finish the current 20 week cycle.

Tom Demark SEQUENTIAL AND COUNTDOWN - this technique spots areas of exhaustion.
We saw a price flip on Monday and we have currently 5 of a setup. It is difficult to say if it will finish or we will see another price flip next week.


Sep 26, 2013
Signals
Short term signal: UP - it will turn down bellow 1694
Intermediate term signal: NEUTRAL - it will turn up above 1704
Comment: The choppy action continues, another failed move above MA50 on the hourly chart. On the other side it looks like it is building
base to move higher. We have a nice looking 20 day cycle exactly at day 20, so the odds favor some kind of a move up before final low for the 40 day cycle.
Watch price behavior for clues:
- top is in and leg down has begun - sell off continues and we see technical damages - move bellow 1670.
- a rally higher underway - not more than a pullback to support 1675-1682 and another move higher.
Levels to watch SP500:
- 1710 - resistance
- 1675-1682 - support level
- 1627 - support level
- 1598 - is major support.
Sep 25, 2013
Signals
Short term signal: DOWN - it will turn up above 1702
Intermediate term signal: DOWN - it will turn up above 1702
Comment: The move down looks too choppy to be impulse but for now every bounce has been sold and we have 5 red days in a row... It looks like some kind of a wedge which is trying to find a bottom.
If the bearish scenario is in play we should see a plunge bellow the lower line of the wedge but probably not lasting too long.
P.S. The levels which I post are not written in stone. You should watch for a entry with low risk around this levels - these are MA50 on the hourly and 15min chart, minor support/resistance levels, MA10 or MA20 on the daily where the price usually find support/resistance.
For example yesterday and today the index is flirting with the 1695-1700 level which if broken will turn the signals down. Than today you see the index trying to surge but fails at MA50 on the 15min and 1h chart(1701-1702) and that is very nice entry at 1700 with very low risk. If you see the index continue moving higher just close the position with several points loss.
Watch price behavior for clues:
- top is in and leg down has begun - sell off continues and we see technical damages - move bellow 1670.
- a rally higher underway - not more than a pullback to support 1675-1682 and another move higher.
Levels to watch SP500:
- 1710-1725 - resistance zone from different trend lines
- 1675-1682 - support
- 1627 support level
- 1598 is major support.
Sep 24, 2013
Signals
Short term signal: UP - it will turn down bellow 1695
Intermediate term signal: UP - it will turn down bellow 1695
Comment: The price bounced two times from around ~1695 and a move bellow that will generate a sell signals.
Watch price behavior for clues:
- top is in and leg down has begun - sell off continues and we see technical damages - move bellow 1670.
- a rally higher underway - not more than a pullback to support 1675-1682 and another move higher.
Levels to watch SP500:
- 1710-1725 - resistance zone from different trend lines
- 1675-1682 - support
- 1627 support level
- 1598 is major support.
Sep 23, 2013
Signals
Short term signal: UP - it will turn down bellow 1700
Intermediate term signal: UP - it will turn down bellow 1695
Comment: Sell signals were not generated but we are very close. The move lower is looking like an impulse currently in wave 4. Lower lower wave 5 is needed and
if we see it the next bounce is sell.
Watch price behavior for clues:
- top is in and leg down has begun - sell off continues and we see technical damages.
- a rally higher underway - not more than a pullback to support 1675-1682 and another move higher.
Levels to watch SP500:
- 1710-1725 - resistance zone from different trend lines
- 1675-1682 - support
- 1627 support level
- 1598 is major support.


Sep 22, 2013
Signals
Short term signal: UP - it will turn down bellow 1700
Intermediate term signal: UP - it will turn down bellow 1695
Comment: Reversal after FOMC... soon we will know more - short term or intermediate term top
Watch price behavior for clues:
- top is in and leg down has begun - sell off continues and we see technical damages.
- a rally higher underway - not more than a pullback to support 1675-1682 and another move higher.
Levels to watch SP500:
- 1710-1725 - resistance zone from different trend lines
- 1675-1682 - support
- 1627 support level
- 1598 is major support.
I find this chart interesting:) Do you know what are you watching? - DJIA the top of the secular bull market 2000. Does it look similar to you? - Yes, just look at the recent price action. Even the length is almost the same roughly three and a half months 13.05-24.08.2000 and 22.05-19.09.2013
For seven months DJIA made five times new all time highs.... and that was not a problem to make a secular top. So do not listen the whole media hype and watch the price action. We still have a valid topping process and if you see the bearish scenarios playing out, which I am showing, get out of longs.


Sep 21, 2013
Weekly review
Short term view - more to the downside expected, but after a bounce from support level - the breakout level.
Intermediate term view - short term top or intermediate term top? we will know in the next 2-3 weeks.
Lets say "surprise" no taper and that is bullish. If you ask me first 5-10 billion more or less it does not matter and second QE will never stop or the system will implode and everything is just talk. For the bears this is not necessary a bad news, if you expect a top you want to see very bullish sentiment and a great news. Markets top on good news not on a bad news.
On the technical front no surprises - move to the upper channel of the wedge and reversal. The DJIA retraced the whole "great news" and we have nice shooting star on the weekly chart, the other indexes does look so bad for now, so I can not state "definitely we have the reversal" but it is a good start for the bears.
For the next week or two - I think the indexes need to cool off. Than we will see how the move lower will look like and we will know which scenario has higher probability. IMPORTANT there is a scenario that an important top is in and a short trade is very good idea.
The bulls need to win some time to consolidate, some indicators/oscillators to reset from extended levels and no more than 50% retracement.
If you are bear you want to see the opposite prices retracing more than 50%, moving bellow support levels MA50 etc.
Trading plan - the price is still above the break out level and MA50 on the hourly chart and I do not expect it to gap lower and plunge. I expect some bounce and when this bounce is over with lower high or higher high with divergence you have a short trade opportunity with very low risk.
TECHNICAL PICTURE
Short term - I expect a test of the break out and another move higher, which should fail. Why a lot of oscillators need to reset and I expect at least a pause.
 - Triple cross(EMA10 and EMA20 crossing EMA50) - triple cross is positive and short term trend is up.
Intermediate term - The wedge pattern is working for now. The price touched the upper boundary and reversed. It looks like we have double divergence on MACD. The bulls must consolidate the price and push higher to negate the divergence or a bigger correction will follow.
 - Trend direction EMA50/MACD - the price is above MA50 and MACD above zero the intermediate term trend is up. Watch out for MACD double divergence.
- Momentum Histogram/RSI - momentum has turned lower.
Long term - the pattern starts to deviate, but the idea for a topping pattern is not negated. We are in up trend until proven wrong but we continue to watch carefully for a top.
 - Trend direction EMA50/MACD - long term trend is up.
- Momentum Histogram/RSI - momentum turned up.
MARKET BREADTH INDICATORS
The Market Breadth Indicators - the signals are bullish, but the indicators do not show a lot of "enthusiasm" and double divergences everywhere .
McClellan Oscillator - pulling back from overbought lvels.
McClellan Summation Index - buy signal, but weak and way bellow previous tops... making a double divergence?
Weekly Stochastic of the Summation Index - buy signal.
Bullish Percentage - buy signal, but no "enthusiasm" at all... double divergence?
Percent of Stocks above MA50 - another lower high.
Fear Indicator VXO - higher low and divergence? bad for stocks.
Issues Advancing - no information to help us.
Put/Call Ratio - the traders are very bullish, which usually happens around tops.
HURST CYCLES
I have decided to swap the daily cycle chart with this one. It gives us more information and it is more useful.
We see that there is 40 trading days dominant cycle the size and length of the rallys and pullbacks/corrections.
Where are we stand now? In the middle of the second 40TD cycle of a 80TD(or 20Week) cycle. So according to the cycles 3/4 of this 80TD are behind us and the market should move lower for the next 2-3 weeks to finish it.
Notice how the last 2 moves lower were bigger ans lasted longer than the usual. This is a sign that the bulls are not so strong and the larger cycles start to pull the price lower. So if the bulls are in control in the next 2-3 weeks we will see sideway move pullback which does not make any technical damages - no more than 50% retracement stay above MA50. See the previous cycle tops - small double tops or sideway moves. Based on the previous tops is my bullish projection the green scenario.
If the bulls are loosing control expect the red scenario and deeper correction at least to MA200.

Looking at the smaller cycles I think that the current 20 week cycle is not finished. It should bottom in the next 2-3 weeks around mid October.

Tom Demark SEQUENTIAL AND COUNTDOWN - this technique spots areas of exhaustion.
There is no price flip for now... is is suspect that the countdown/combo will be finished.
 Bar 2 of a setup printed this week. Look at the top at the beginning of 2011(the first 13 on the left of the chart). Are we there finished weekly countdown followed by minor higher high before a serious correction?

Intermediate term view - short term top or intermediate term top? we will know in the next 2-3 weeks.
Lets say "surprise" no taper and that is bullish. If you ask me first 5-10 billion more or less it does not matter and second QE will never stop or the system will implode and everything is just talk. For the bears this is not necessary a bad news, if you expect a top you want to see very bullish sentiment and a great news. Markets top on good news not on a bad news.
On the technical front no surprises - move to the upper channel of the wedge and reversal. The DJIA retraced the whole "great news" and we have nice shooting star on the weekly chart, the other indexes does look so bad for now, so I can not state "definitely we have the reversal" but it is a good start for the bears.
For the next week or two - I think the indexes need to cool off. Than we will see how the move lower will look like and we will know which scenario has higher probability. IMPORTANT there is a scenario that an important top is in and a short trade is very good idea.
The bulls need to win some time to consolidate, some indicators/oscillators to reset from extended levels and no more than 50% retracement.
If you are bear you want to see the opposite prices retracing more than 50%, moving bellow support levels MA50 etc.
Trading plan - the price is still above the break out level and MA50 on the hourly chart and I do not expect it to gap lower and plunge. I expect some bounce and when this bounce is over with lower high or higher high with divergence you have a short trade opportunity with very low risk.
TECHNICAL PICTURE
Short term - I expect a test of the break out and another move higher, which should fail. Why a lot of oscillators need to reset and I expect at least a pause.

Intermediate term - The wedge pattern is working for now. The price touched the upper boundary and reversed. It looks like we have double divergence on MACD. The bulls must consolidate the price and push higher to negate the divergence or a bigger correction will follow.

- Momentum Histogram/RSI - momentum has turned lower.
Long term - the pattern starts to deviate, but the idea for a topping pattern is not negated. We are in up trend until proven wrong but we continue to watch carefully for a top.

- Momentum Histogram/RSI - momentum turned up.
MARKET BREADTH INDICATORS
The Market Breadth Indicators - the signals are bullish, but the indicators do not show a lot of "enthusiasm" and double divergences everywhere .
McClellan Oscillator - pulling back from overbought lvels.
McClellan Summation Index - buy signal, but weak and way bellow previous tops... making a double divergence?
Weekly Stochastic of the Summation Index - buy signal.
Bullish Percentage - buy signal, but no "enthusiasm" at all... double divergence?
Percent of Stocks above MA50 - another lower high.
Fear Indicator VXO - higher low and divergence? bad for stocks.
Issues Advancing - no information to help us.
Put/Call Ratio - the traders are very bullish, which usually happens around tops.
HURST CYCLES
I have decided to swap the daily cycle chart with this one. It gives us more information and it is more useful.
We see that there is 40 trading days dominant cycle the size and length of the rallys and pullbacks/corrections.
Where are we stand now? In the middle of the second 40TD cycle of a 80TD(or 20Week) cycle. So according to the cycles 3/4 of this 80TD are behind us and the market should move lower for the next 2-3 weeks to finish it.
Notice how the last 2 moves lower were bigger ans lasted longer than the usual. This is a sign that the bulls are not so strong and the larger cycles start to pull the price lower. So if the bulls are in control in the next 2-3 weeks we will see sideway move pullback which does not make any technical damages - no more than 50% retracement stay above MA50. See the previous cycle tops - small double tops or sideway moves. Based on the previous tops is my bullish projection the green scenario.
If the bulls are loosing control expect the red scenario and deeper correction at least to MA200.

Looking at the smaller cycles I think that the current 20 week cycle is not finished. It should bottom in the next 2-3 weeks around mid October.

Tom Demark SEQUENTIAL AND COUNTDOWN - this technique spots areas of exhaustion.
There is no price flip for now... is is suspect that the countdown/combo will be finished.


Sep 19, 2013
Update
No change today see bellow, boring day... I think we are close to a short term top - NYMO extremes, Put/Call ratio extremes, the Histogram and RSI need to cool off.
Sep 18, 2013
Signals
Short term signal: UP - it will turn down bellow 1700
Intermediate term signal: UP - it will turn down bellow 1670
Comment: Nice present for the bulls and now the bullish scenario has higher probability.
Watch price behavior for clues:
- a rally higher underway - not more than a pullback to support 1675-1682 and another move higher.
- top is near and leg down to begin - sharp sell(not in sight at the moment)
Levels to watch SP500:
- 1710-1725 - resistance zone from different trend lines
- 1675-1682 - support
- 1627 support level
- 1598 is major support.
The upper boundary of the wedge reached as expected. It does not look like a reversal is around the corner. Bullish scenario green (with higher probability now) short living pullback, the trend to take a breath, and move higher after that. Bearish scenario red waves 4-5 to finish the ending diagonal and then more serious correction.


Sep 17, 2013
Signals
Short term signal: UP - it will turn down bellow 1694
Intermediate term signal: UP - it will turn down bellow 1678
Comment: No change waiting for FOMC...
Watch price behavior for clues:
- top is near and leg down to begin - topping and sharp sell after FOMC.
- a rally higher underway - not more than a pullback to support 1675-1682 and another move higher.
Levels to watch SP500:
- 1710-1725 - resistance zone from different trend lines
- 1675-1682 - support
- 1627 support level
- 1598 is major support.
Sep 16, 2013
Signals
Short term signal: UP - it will turn down bellow 1690
Intermediate term signal: UP - it will turn down bellow 1678
Comment: The price action looks like exhaustion gap. We had one runaway gap around 1670 and you can see the difference clearly on the chart - gap and move higher and today gap and move... lower. It is too early to get bearish, but today the idea for a top does not look so stupid. The trend stays up and as I wrote the bears should master a reversal this week or the pattern which I am showing will be invalidated.
Watch price behavior for clues:
- top is near and leg down to begin - 2-3 days topping and sharp sell after FOMC.
- a rally higher underway - not more than a pullback to support around 1682 and another move higher.
Levels to watch SP500:
- 1710-1725 - resistance zone from different trend lines
- 1675-1682 - support
- 1627 support level
- 1598 is major support.
Sep 15, 2013
Weekly review
Short term view - more upside at least till FOMC
Intermediate term view - this coming week we will know if we saw already intermediate term bottom or not.
The move last longer and reached higher levels than expected... and know there is a probability that the short term bottom turns out to be an intermediate term bottom.
What is next? - The indicators look like they are reversing and the next intermediate term swing is underway, on the other side Market breadth indicators are weak after two green weeks, cycles do not fit at all. My bias is for a topping pattern, but based only on indicators to say now Up or Down is like betting in a casino. I prefer to wait several days an follow the signals. Soon we will know more.
For the next week we have the positive news about Syria, I think the news is already priced in but with FOMC on 18.September I do not think that we will see something on the downside. So short term more upside, intermediate term we will know after FOMC. Bearish case max to 1720-1725 and reversal next week, bullish case move above 1725 and/or no reversal next week(see the daily chart).
TECHNICAL PICTURE
Short term - positive news and FOMC the pressure will be on the upside. I can not predict the exact squiggles but do not short before Wednesday and you can use pullbacks for a short term long trade.
 - Triple cross(EMA10 and EMA20 crossing EMA50) - triple cross is positive and short term trend is up.
Intermediate term - my forecast for a topping sequence is in serious danger:) For bearish outcome the bears need reversal next week from 1690-1700-1710-1720 it is not important, important is reversal and very strong sell off. If we do not see a reversal next week, instead third green and strong week that will mean the bulls are wining the battle and we will watch the red scenario.
 - Trend direction EMA50/MACD - the price is above MA50 and MACD above zero the intermediate term trend is up.
- Momentum Histogram/RSI - momentum is up, short term trend is up.
Long term - the pattern is still valid but the bearish case should play out. If the bulls win the battle it will be negated.
 - Trend direction EMA50/MACD - long term trend is up.
- Momentum Histogram/RSI - momentum turned up.
MARKET BREADTH INDICATORS
The Market Breadth Indicators - confusing signals and I can present you "evidence" for both cases bearish and bullish. They look like reversing for the next intermediate term rally do not show a lot of "enthusiasm".
McClellan Oscillator - shows small divergence... too early to bet on it.
McClellan Summation Index - issued buy signal, but weak and way bellow previous tops... making a double divergence?
Weekly Stochastic of the Summation Index - issued buy signal
Bullish Percentage - issued buy signal, but no "enthusiasm" at all... double divergence?
Percent of Stocks above MA50 - no information to help us.
Fear Indicator VXO - higher low and divergence? bad for stocks.
Issues Advancing - bounce from oversold levels and for the strongest part of this rally does not moved up much, but still positive signal.
Put/Call Ratio - the traders are very bullish, which usually happens around tops.
HURST CYCLES
The daily chart with the shorter cycles favors the bearish scenario. They do not fit very nice(unless if you are very "creative") with finished 20 week cycle and intermediate term bottom. Only 46 days... this is waaaay to short, the half of a normal cycle. But again we must see reversal next week... at the end the price action is more important than nice looking cycles.

It is difficult to say if we saw 20 week cycle bottom. 10 weeks will be the shortest one which I have seen till now and it is a little bit suspect especially if take into account the shorter cycle which do not fit at all. Next week we will know.

Tom Demark SEQUENTIAL AND COUNTDOWN - this technique spots areas of exhaustion.
Setup was finished.. that does not mean sell right away. Wait for a price flip next week if you want to go short, or there is no reversal and we will start countdown.
 Price flip on the weekly chart. Next week we will see what happens.

Intermediate term view - this coming week we will know if we saw already intermediate term bottom or not.
The move last longer and reached higher levels than expected... and know there is a probability that the short term bottom turns out to be an intermediate term bottom.
What is next? - The indicators look like they are reversing and the next intermediate term swing is underway, on the other side Market breadth indicators are weak after two green weeks, cycles do not fit at all. My bias is for a topping pattern, but based only on indicators to say now Up or Down is like betting in a casino. I prefer to wait several days an follow the signals. Soon we will know more.
For the next week we have the positive news about Syria, I think the news is already priced in but with FOMC on 18.September I do not think that we will see something on the downside. So short term more upside, intermediate term we will know after FOMC. Bearish case max to 1720-1725 and reversal next week, bullish case move above 1725 and/or no reversal next week(see the daily chart).
TECHNICAL PICTURE
Short term - positive news and FOMC the pressure will be on the upside. I can not predict the exact squiggles but do not short before Wednesday and you can use pullbacks for a short term long trade.

Intermediate term - my forecast for a topping sequence is in serious danger:) For bearish outcome the bears need reversal next week from 1690-1700-1710-1720 it is not important, important is reversal and very strong sell off. If we do not see a reversal next week, instead third green and strong week that will mean the bulls are wining the battle and we will watch the red scenario.

- Momentum Histogram/RSI - momentum is up, short term trend is up.
Long term - the pattern is still valid but the bearish case should play out. If the bulls win the battle it will be negated.

- Momentum Histogram/RSI - momentum turned up.
MARKET BREADTH INDICATORS
The Market Breadth Indicators - confusing signals and I can present you "evidence" for both cases bearish and bullish. They look like reversing for the next intermediate term rally do not show a lot of "enthusiasm".
McClellan Oscillator - shows small divergence... too early to bet on it.
McClellan Summation Index - issued buy signal, but weak and way bellow previous tops... making a double divergence?
Weekly Stochastic of the Summation Index - issued buy signal
Bullish Percentage - issued buy signal, but no "enthusiasm" at all... double divergence?
Percent of Stocks above MA50 - no information to help us.
Fear Indicator VXO - higher low and divergence? bad for stocks.
Issues Advancing - bounce from oversold levels and for the strongest part of this rally does not moved up much, but still positive signal.
Put/Call Ratio - the traders are very bullish, which usually happens around tops.
HURST CYCLES
The daily chart with the shorter cycles favors the bearish scenario. They do not fit very nice(unless if you are very "creative") with finished 20 week cycle and intermediate term bottom. Only 46 days... this is waaaay to short, the half of a normal cycle. But again we must see reversal next week... at the end the price action is more important than nice looking cycles.

It is difficult to say if we saw 20 week cycle bottom. 10 weeks will be the shortest one which I have seen till now and it is a little bit suspect especially if take into account the shorter cycle which do not fit at all. Next week we will know.

Tom Demark SEQUENTIAL AND COUNTDOWN - this technique spots areas of exhaustion.
Setup was finished.. that does not mean sell right away. Wait for a price flip next week if you want to go short, or there is no reversal and we will start countdown.


Sep 13, 2013
Did you make your homework:)
The chart(DJIA) shows you that you must do your homework:) and spent a few minutes per day to do a basic mathematics.
First you can see that the same pattern repeats - a move higher for at least 25-30 days and size 7%-8%. Second if you do not use cycle or you think it is fantasy... you can not deny what you see on the chart - a very nice 40 trading days cycle. Now you know, for example, why I was expecting to see a short term bottom - NYMO at -100 and cycle longer than 40 day or it was time for a bottom.
What says the chart about the future? The swing which begun in the end of June is too short, at least for now, only 29 trading days with average length for a swing at least 45 trading days and 10%
(the rise since Nov.2012 to Mai.2013 is one move it is not interrupted by a correction 5%-8%, only pullbacks) This happens around tops. The bulls still have the time but the current move should master really a strong rally.
Short said how do you know who is stronger bears or bulls? - If you are bear you want to see the current move shorter than 20-25 days and/or top lower than 7%-8%(15800-15900). If you are bull you want to see the current move lasting for another 6-8 weeks(we have a flat correction A-B-C behind us?) and move higher than 16000.


Sep 12, 2013
Signals
Short term signal: UP - it will turn down bellow 1678
Intermediate term signal: UP - it will turn down bellow 1654
Comment: No change - clear 5 waves for the advance from 1640 that means pullback, which should stay above 1660 for the bullish case.
Watch price behavior for clues:
- short term top is near and leg down to begin - 2-3 days sharp sell off moving through support levels.
- a rally higher underway - not more than a pullback to around 1660.
Levels to watch SP500:
- 1675-1682 - resistance
- 1645-1655 important area, congestion zone, now it is a support.
- 1627 support level
- 1598 is major support.
Update
I think that the topping pattern mutated to this... ending diagonal. Move above 1725 will invalidate it, move bellow 1654 and we are back to the previous scenario.


Sep 11, 2013
Signals
Short term signal: UP - it will turn down bellow 1678
Intermediate term signal: UP - it will turn down bellow 1654
Comment: Clear 5 waves for the advance from 1640 before that do not ask me... that means pullback which should stay above 1660 for the bullish case.
The bearish case is not dead but the price should reverse hard and move fast through support.
Watch price behavior for clues:
- short term top is near and leg down to begin - 2-3 days sharp sell off moving through support levels like hot knife through butter:)
- a rally higher underway - not more than a pullback to around 1660.
Levels to watch SP500:
- 1675-1682 - resistance
- 1645-1655 important area, congestion zone, now it is a support.
- 1627 support level
- 1598 is major support.
Update
These are the charts which make me think... hmmm this rally should not last very long. On 18.September is FOMC and I think this will be the top for the retracement. Pullback for the rest of the week and move higher till 18.September and probably 1700. See the hourly chart bellow.
Where are the advancing issues???? few stocks are rising
 Put-to-Call extremes - the bullish sentiment has not been cleared at all. We saw just pullback 4,5%, no correction no purge of greed/bullishness.
 P.S - do you remember the NYMO chart? - deep and long lasting retracement.... the first occasion with 15 days is repeating for now.


Sep 10, 2013
Signals
Short term signal: UP - it will turn down bellow 1654
Intermediate term signal: UP - it will turn down bellow 1654
Comment: Now the intermediate trend looks up and stays up until we see something bearish or weakness. I do not think it will last too long but important are the signals
and not what I think:)
Watch price behavior for clues:
- short term top is near - SP500 should find resistance around 1675-1682 and topping visible on the shorter time frames should start.
- a rally higher has begun - another 2-3 strong days moving above resistance ~1682
Levels to watch SP500:
- 1675-1682 - resistance
- 1645-1655 important area, congestion zone, now it is a support.
- 1627 support level
- 1598 is major support.
Update
The last resistance was reached. SP500 is now in a zone where both scenarios bullish green and bearish red are possible. No bearish signs, the signals are up so we must respect the price action that is why the bullish outcome is the preferred scenario. For those of you who followed the signals to the long side congratulations:) it was too choppy for me to go long... well I was wrong.
Short term it looks overbought. Logical move will be a pause to the previous resistance level around 1660 where the both trend lines and MA 50 on the daily and hourly charts will be tested.


Sep 9, 2013
Signals
Short term signal: UP - it will turn down bellow 1654
Intermediate term signal: UP - it will turn down bellow 1654
Comment: The signals continue pointing up. No opening lower and move to 1670-1675 has followed. Not much of a surprise, I knew that something on the upside is possible, but not really such parabolic
move if you watch it on the smaller time frames. Ok there is two options exhaustion to the upside, topping should follow and the next leg lower
or this is part of a new leg up - than we should see at least another strong day 15-20 points in the next days.
Watch price behavior for clues:
- short term top is near - SP500 should find resistance around 1675 and topping visible on the shorter time frames should start.
- a rally higher has begun - another 2-3 strong days moving above resistance ~1682
Levels to watch SP500:
- 1675-1682 - resistance
- 1645-1655 important area, congestion zone, now it is a support.
- 1627 support level
- 1598 is major support.
Sep 8, 2013
Signals
Short term signal: UP - it will turn down bellow 1640
Intermediate term signal: UP - it will turn down bellow 1640
Comment: The signals are technically still up but the move up looks like bearish flag and price should soon turn down again. Confirmation for a reversal will be a move bellow the last low ~1640.
My plan - if the indexes open lower than the close on Friday short it with stop several points above the close from Friday. If the next leg lower has begun
it should move lower and not look back. If there is one more push higher left we will wait patiently for another short entry around 1670-1675.
If I am wrong and this is an intermediate term bottom, it will be the most odd one I have ever seen:)
Watch price behavior for clues:
- short term bottom - SP500 should find support between 1625-1630(check) and move above 1655-1660(check), but the move should be corrective(check) and stay bellow 1682
- a rally higher to begin - 2-3 strong days up reaching at least resistance ~1682 - just the opposite is happening 7 days to retrace one day sell off
Levels to watch SP500:
- 1682 - resistance
- 1645-1655 important area, congestion zone, now it is a resistance.
- 1627 support level
- 1598 is major support.
Sep 7, 2013
Weekly review
Short term view - I do not know if one more push higher is left, but it is time to think for short trade.
Intermediate term view - one more leg lower but short living.... 2 weeks probably and intermediate term bottom.
We had the expected short term bottom and the choppy move higher confirms that this should be only correction before one final sell off.
The move higher already looks awful - very choppy, tested MA50 on the daily chart, the upper trend line of the channel(the first chart) just a few points shy of 50% Fibo retracement and all that with divergences on the hourly chart. It can always try to push one more time higher to overshoot the channel and touch resistance at 50% Fibo around 1670, but the next move should be lower.
TECHNICAL PICTURE
Short term - we either saw the top on Friday or the move will top out few points higher on Monday-Tuesday. It does not matter the next bigger move is down.
 - Triple cross(EMA10 and EMA20 crossing EMA50) - triple cross this week and short term trend is up.
Intermediate term - SP500 is testing MA50 with bearish flag and one more sell off should follow. It will be short living with target between 1600-1575 - 38% Fibo,MA200,the June low.
 - Trend direction EMA50/MACD - the price is bellow MA50 and MACD bellow zero the intermediate term trend is down.
- Momentum Histogram/RSI - momentum is still up, short term trend is still up.
Long term - no change, the indexes are following the plan. MACD is nearing it's trend line and the price MA50... I think intermediate term bottom is few weeks away finishing leg three of the pattern.
 - Trend direction EMA50/MACD - long term trend is up, but MACD and the oscillators show divergences and we must be prepared for a bigger correction.
- Momentum Histogram/RSI - momentum is pointing down, intermediate term trend is down.
MARKET BREADTH INDICATORS
The Market Breadth Indicators - the oscillators have reseted from oversold levels McClellan Oscillator for example is above the zero now. The trend indicators are still pointing lower.
McClellan Oscillator - moved back in positive territory after hitting extreme -100. We have the short term bottom as expected.
McClellan Summation Index - still showing sell signal, correction not over.
Weekly Stochastic of the Summation Index - sell signal, but reached oversold levels. We should see something on the upside, probably after 2-3 weeks and 20 week cycle bottom.
Bullish Percentage - sell signal pointing lower, but still at higher levels. This is just a correction...
Percent of Stocks above MA50 - some relief and moving to around 50. One more push lower and it will look perfect.
Fear Indicator VXO - Cool off as expected after several days outside the bollinger bands.
Issues Advancing - relief after extreme levels, another move lower with divergence like the previous bottom will look great.
Issues Declining - the same story like above but reverse:)
HURST CYCLES
The shortest cycles are not very clear, but it is clear that the longer cycle has topped out making a nice arc. The second important thing is - look at the previous cycle how it topped very late in the cycle and the current one how it topped early in the cycle. That means that the 18 month cycle shown on the second chart already topped out and it is pulling the prices lower.

At week 11 already, we should see intermediate term bottom in the next 2-3 weeks and rally for several weeks before very serious correction for 18 month cycle low.

Tom Demark SEQUENTIAL AND COUNTDOWN - this technique spots areas of exhaustion.
At 3 of a sell setup... I do not think it will be finished. Maybe four on Monday, but SP500 must close above 1653 on Tuesday or we will see another price flip and short term reversal lower.
 No change the next week of the setup currently at four. Next week the bears should show up and the week should close bellow 1655 for a 5 of the setup or it will be negated.

Intermediate term view - one more leg lower but short living.... 2 weeks probably and intermediate term bottom.
We had the expected short term bottom and the choppy move higher confirms that this should be only correction before one final sell off.
The move higher already looks awful - very choppy, tested MA50 on the daily chart, the upper trend line of the channel(the first chart) just a few points shy of 50% Fibo retracement and all that with divergences on the hourly chart. It can always try to push one more time higher to overshoot the channel and touch resistance at 50% Fibo around 1670, but the next move should be lower.
TECHNICAL PICTURE
Short term - we either saw the top on Friday or the move will top out few points higher on Monday-Tuesday. It does not matter the next bigger move is down.

Intermediate term - SP500 is testing MA50 with bearish flag and one more sell off should follow. It will be short living with target between 1600-1575 - 38% Fibo,MA200,the June low.

- Momentum Histogram/RSI - momentum is still up, short term trend is still up.
Long term - no change, the indexes are following the plan. MACD is nearing it's trend line and the price MA50... I think intermediate term bottom is few weeks away finishing leg three of the pattern.

- Momentum Histogram/RSI - momentum is pointing down, intermediate term trend is down.
MARKET BREADTH INDICATORS
The Market Breadth Indicators - the oscillators have reseted from oversold levels McClellan Oscillator for example is above the zero now. The trend indicators are still pointing lower.
McClellan Oscillator - moved back in positive territory after hitting extreme -100. We have the short term bottom as expected.
McClellan Summation Index - still showing sell signal, correction not over.
Weekly Stochastic of the Summation Index - sell signal, but reached oversold levels. We should see something on the upside, probably after 2-3 weeks and 20 week cycle bottom.
Bullish Percentage - sell signal pointing lower, but still at higher levels. This is just a correction...
Percent of Stocks above MA50 - some relief and moving to around 50. One more push lower and it will look perfect.
Fear Indicator VXO - Cool off as expected after several days outside the bollinger bands.
Issues Advancing - relief after extreme levels, another move lower with divergence like the previous bottom will look great.
Issues Declining - the same story like above but reverse:)
HURST CYCLES
The shortest cycles are not very clear, but it is clear that the longer cycle has topped out making a nice arc. The second important thing is - look at the previous cycle how it topped very late in the cycle and the current one how it topped early in the cycle. That means that the 18 month cycle shown on the second chart already topped out and it is pulling the prices lower.

At week 11 already, we should see intermediate term bottom in the next 2-3 weeks and rally for several weeks before very serious correction for 18 month cycle low.

Tom Demark SEQUENTIAL AND COUNTDOWN - this technique spots areas of exhaustion.
At 3 of a sell setup... I do not think it will be finished. Maybe four on Monday, but SP500 must close above 1653 on Tuesday or we will see another price flip and short term reversal lower.
Sep 5, 2013
Signals
Short term signal: UP - down bellow 1637
Intermediate term signal: UP
Comment: Nothing interesting today, SP500 almost touched 1660:) as expected. Technically the signals are up but this move is not... very strong. Short term I do not know what will happen, if there is one more push higher(see the chart from yesterday) or after test of MA20 and MA50 the sell off will resume. I can only say that this move is very choppy and has corrective nature, which means one more push lower is to expect.
Watch price behavior for clues:
- short term bottom - SP500 should find support between 1625-1630(check) and move above 1655-1660(almost), but the move should be corrective(check) and stay bellow 1682
- a rally higher has begun - 2-3 strong days up reaching at least resistance ~1682 (not really what is happening)
Levels to watch SP500:
- 1682 - resistance
- 1645-1655 important area, congestion zone, now it is a resistance.
- 1627 support level
- 1598 is major support.
Sep 4, 2013
Signals
Short term signal: UP - down bellow 1637
Intermediate term signal: UP - It is still not very convincing... when correction is over you see 2-3 strong, nothing of that till now.
Comment: A lot of choppy moves... as I wrote yesterday watch out for opening higher. MA50 and MA20 are around ~1660. I think SP500 will touch them, small pullback, and will see move to 1670-1675.
The move is clearly corrective so another leg down should follow to finish the correction.
Watch price behavior for clues:
- short term bottom - SP500 should find support between 1625-1630(check) and move above 1655-1660(almost), but the move should be corrective(check) and stay bellow 1682
- a rally higher has begun - 2-3 strong days up reaching at least resistance ~1682 (not really what is happening)
Levels to watch SP500:
- 1682 - resistance
- 1645-1655 important area, congestion zone, now it is a resistance.
- 1627 support level
- 1598 is major support.


Sep 3, 2013
Signals
Short term signal: NEUTRAL - down bellow 1627, up above 1651
Intermediate term signal: DOWN - up above 1651. As I have said yesterday not really to trust and get long....
Comment: Not really convincing the bulls... another move lower as shown on the chart bellow has higher probability.
Be careful for a 1-2(from the bottom on Friday) and now 3 from a wave higher. We will know tomorrow - if the short term bottom is in and this is wave 3, SP500 should open higher and not look back for the next 2-3 days.
Watch price behavior for clues:
- short term bottom - SP500 should find support between 1625-1630(check) and move above 1655-1660, but the move should be corrective(check) and stay bellow 1682
- a rally higher has begun - 2-3 strong days up reaching at least resistance ~1682(not really what is happening)
Levels to watch SP500:
- 1682 - resistance
- 1645-1655 important area, congestion zone, now it is a resistance.
- 1627 support level
- 1598 is major support.

Sep 2, 2013
Signals
Short term signal: UP
Intermediate term signal: UP - following the rules it is up, but we will see the next several days if I am right and this is only relief move higher before another leg down.
Comment: Looking at the futures my forecast for a short term bottom and positive opening is right... but not very helpful - gaps. I think the news that there will no strike on Syria caused a huge gap up on the DAX and probably SP500 will gap higher tomorrow too.
This move even if it is corrective should last for a while and I expect more upside.... but I am a little bit conservative and I would wait for a pullback to jump on a short term long trade.
Watch price behavior for clues:
- short term bottom - SP500 should find support between 1625-1630(check) and move above 1655-1660, but the move should be corrective and stay bellow 1682
- a rally higher has begun - 2-3 strong days up reaching fast at least resistance ~1682
Levels to watch SP500:
- 1682 - resistance
- 1645-1655 important area, congestion zone, now it is a resistance.
- 1625 support level
- 1598 is major support.
Subscribe to:
Posts (Atom)