I was expecting fifth wave and retracement b or 2. I think we saw extended fifth wave followed by b wave as expected just the volatility was very high. The decline is too big to count an impulse, projection will show unrealistic targets so we have waves a and b of much bigger corrective pattern.
This is in line with my expectation for a big decline with corrective waves so nothing new to add - the same like last week.
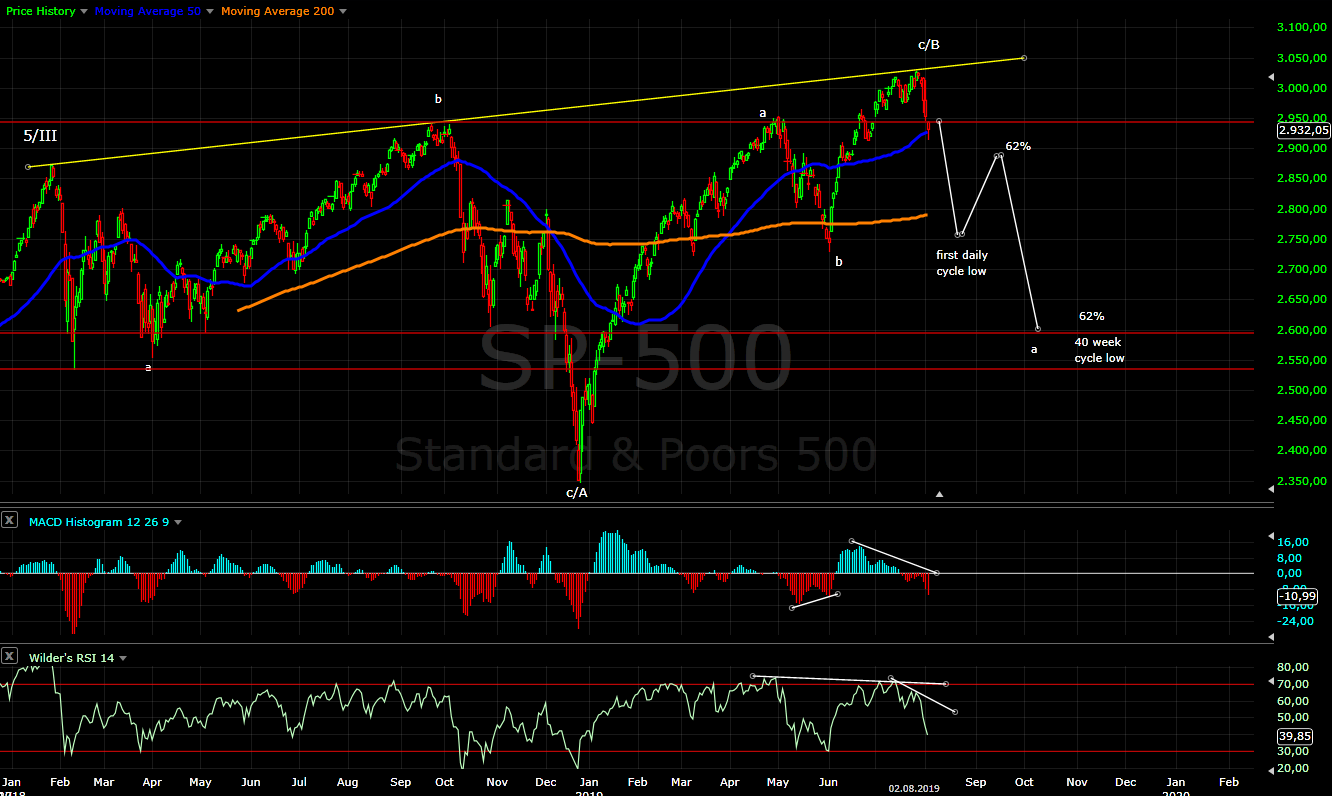
TECHNICAL PICTURE and ELLIOTT WAVES
Short term - the first leg lower looks like impulse to me with extended fifth wave. Wave 1 of an impulse does not fit - neither time nor price targets. I think we have a-b with c to follow. The most common measurement is c=a and it is getting interesting:) - this will hit the trend line connecting the lows from March and June(see daily chart).
As long as the resistance zone around 2960 holds the move lower continues. Above it and we have something else.
Intermediate term - so far the price action confirms the expectations from last week - zig-zag lower testing the last two lows slightly below MA200 which should be the low of the daily cycle. MA10 and MA50 has been tested, the move continue to follow the script from October 2018 even the candles and indicators look the same, so next we should see wave c lower. Now we wait and see if the pattern plays out next week.
Long term - I expect decline in three waves with the first important low in October - a/C/IV and 40 week cycle low.
MARKET BREADTH INDICATORS
Market Breadth Indicators - some were close to oversold levels, but not really oversold or something to suggest a low.
McClellan Oscillator - oversold level, reset and turn lower again.
McClellan Summation Index - sell signal.
Weekly Stochastic of the Summation Index - sell signal.
Bullish Percentage - sell signal.
Percent of Stocks above MA50 - retraced in the middle of the range, I want to see oversold level for a low.
Fear Indicator VIX - resetting lower after explosive move higher.
Advance-Decline Issues - in the middle of the range and turned lower again, I want to see oversold level for a low.
HURST CYCLES
Day 48, with this strong bounce it looks like possible daily cycle low, but this time I will follow the pattern and wait for one more decline.
Week 10 for the 20 week cycle. If you look at the DAX or EEM you will see the following:
- the current 20 week cycle made a top at week 5/6, which means bearish left translated cycle and it is declining already.
- it broke below the low of the previous 20 week cycle, which is confirmation that the cycle of higher degree(40 week) made a high and it is declining.
Short said forget about new highs before the 40 week cycle makes a low in October/November.
On the surface the US markets look stronger moving higher for 8 weeks, but in reality it is just sideway move in July and 10 points higher in week 8 above week 6. So in theory stronger in practice the same like DAX and EEM.... I can not imagine how the US markets will decouple and suddenly make higher highs now or in September.
Tom Demark SEQUENTIAL AND COUNTDOWN - this technique spots areas of exhaustion.
The setup was negated at day 7, which is another sign that we do not have an impulse structure rather corrective decline.