Apr 25, 2020

Weekly preview

It seems my suspicion that the move up will take more time is getting confirmed. I was expecting a little bit more action to the downside for this corrective move lower, but now we know it is corrective and another up move should follow before we see something serious to the downside.
If you look closely other indexes like NYSE,RUT,DAX,XLF you will see that the correction begun earlier 9th or 14th of March and it is sideways move so far. This is not a convincing break lower from the wedge - so the conclusion is we have a corrective move even for weak indexes like RUT.

The big picture - I am waiting to see important cycle low later and I do not believe the correction(which begun in 2018) is over. The caveat is the corrective pattern could be completed with higher low.


TECHNICAL PICTURE and ELLIOTT WAVES
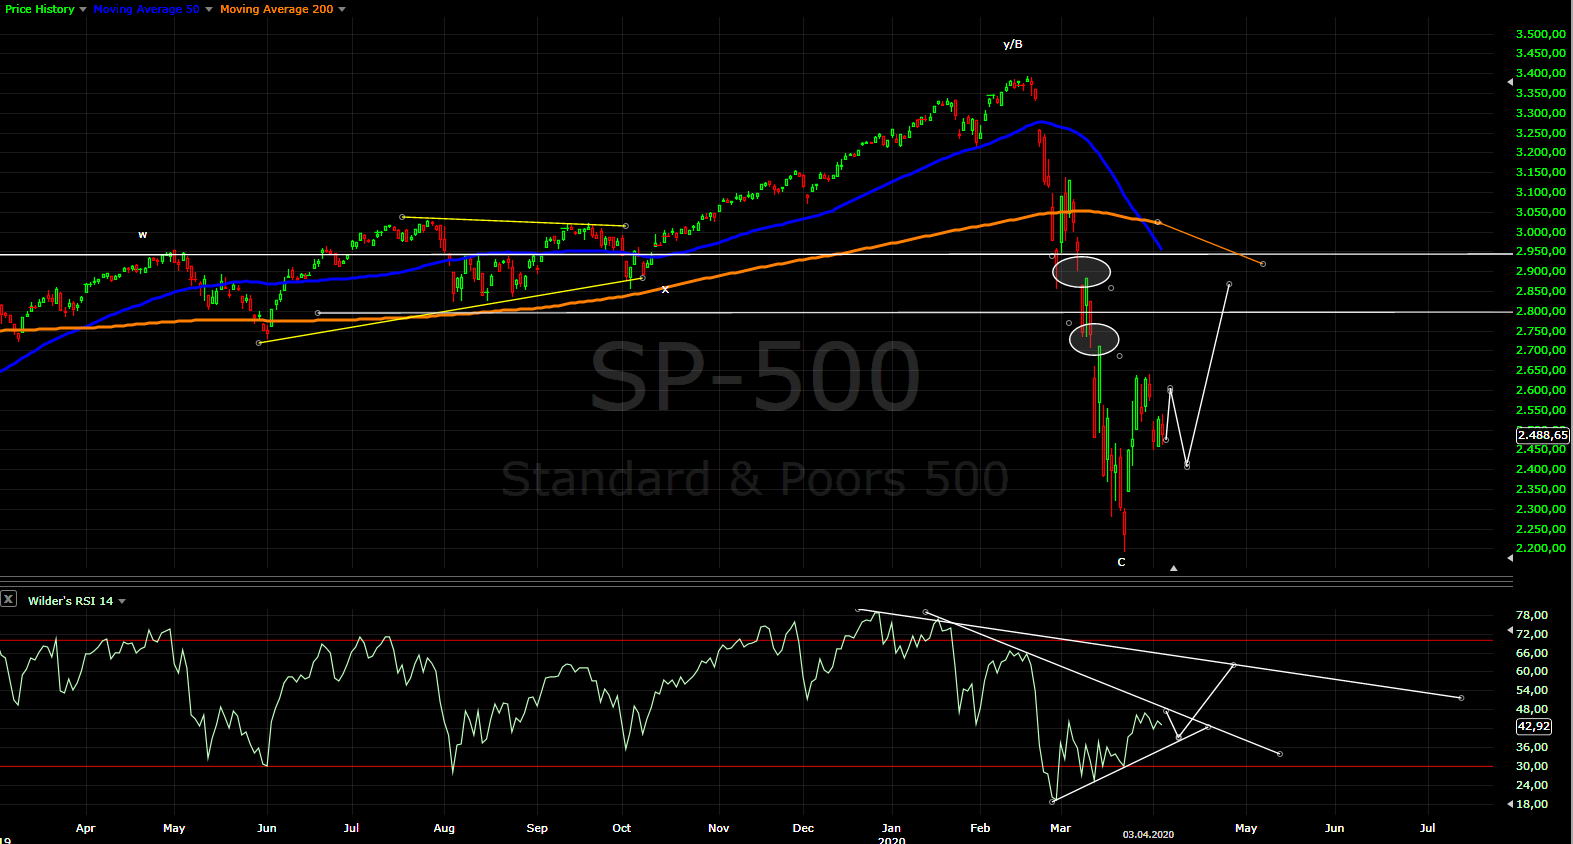
Short term - the wedge breaking with sideways move, which means it is not very likely to see it retraced rather forming a channel.
You can start counting from 14th flat and now x or from 17th and now b - it does not matter I think we should see at least one more move lower before the correction is completed.


Intermediate term - around the low the forecast was to see minimum 50% retracement with 2 gaps closed and it is likely to see MA200 tested with the third gap closed. We have the minimum and with corrective looking move so far the odds are rising, for the second part of the forecast coming true.


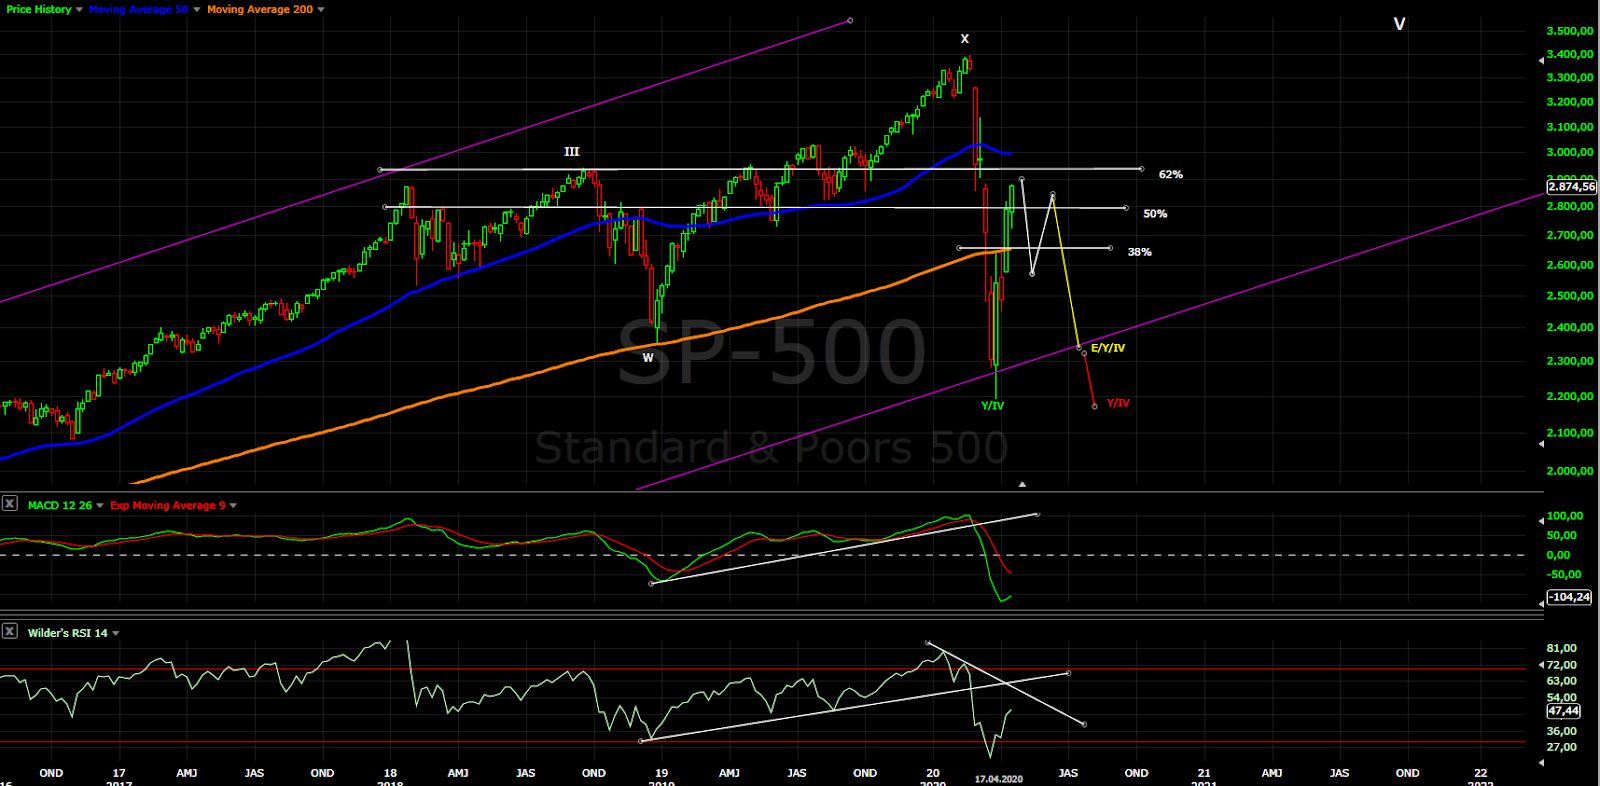
Long term - nothing new, the possible patterns bellow. Statistically the red one is the most likely.


MARKET BREADTH INDICATORS
Market Breadth Indicators - taking a breath from the huge run up, for some indicators to very overbought levels.
McClellan Oscillator - very overbought level hit, several lower highs, it is time to see it below zero.
McClellan Summation Index - buy signal.
Weekly Stochastic of the Summation Index - buy signal.
Bullish Percentage - below 70, retracing after very overbought level.
Percent of Stocks above MA50 - nothing interesting, above 25.
Fear Indicator VIX - still too high, not buying this rally. I want to see divergence, before important low for the indexes.
Advance-Decline Issues - heading lower around the zero line. Still respecting the trend line connecting the highs so no signs of reversal.


HURST CYCLES
Daily(trading) cycle - technically buy, but this time I think the trigger should be ignored - the context(waves,cycles,indicators) does not confirm it.
Such one day closes below MA10 occur some times, but RSI bounced from MA and did not close below it. On the other side price is testing the broken trend line. Nothing convincing in both directions.


Hurst cycles - RSI says this leg up is over and move of the same degree lower is running. I think the indexes are heading into 40d/5w cycle low.


Week 12 for the 20w cycle. I suspect we have 5w high and now heading lower into 5w low.

Apr 18, 2020

Weekly preview

Now we have two legs higher with the same size hitting resistance and testing MA50 daily. The pattern looks like a zigzag with a wedge shape. Typical outcome with this setup is at least pullback lower even if there is more to the upside.

I have the feeling the bigger pattern is more complicated than most expect, not so simple like the indexes will move much lower. NDX retraced more than 62% which means the pattern from the top in February is not a simple zig-zag and much lower is not assured fact.


TECHNICAL PICTURE and ELLIOTT WAVES
Short term - I see zig-zag with wedge shape so next we should see something lower. The wedge in 2019 did not end well, big portion of the wedge lower is retraced, lets see what happens with this one:) Waiting for the move up to be completed then I expect at least 50% retracement to support and closing the gaps.


Intermediate term - the second gap and MA50 tested, now I expect to see at least a pullback. I have the suspicion this is another x wave... the implication is there is no need to see lower low for complete pattern.


Long term - waiting to see how the pattern will be completed. I can only guess now... statistically the red one is most common
- most bullish option we saw the low(green) - what I miss is to see impulse higher...
- most common corrective pattern is zig-zag(red).
- triangle(yellow) is an option too, but it does not work for all indexes.


MARKET BREADTH INDICATORS
Market Breadth Indicators - showing strength, but I am expecting the real buy signal after divergences.
McClellan Oscillator - short term divergence.
McClellan Summation Index - buy signal.
Weekly Stochastic of the Summation Index - buy signal.
Bullish Percentage - short term divergence.
Percent of Stocks above MA50 - now above 25.
Fear Indicator VIX - still too high not buying this rally. I am waiting for divergence.
Advance-Decline Issues - still below the trend line connecting the highs and has not reached overbought level.


HURST CYCLES
Daily(trading) cycle - buy signal, but day 41 high-to-high. It is mature so not the time to chase it higher.


Hurst cycles - high-to-high we should see a top according to the sine wave and it is possible to be 20w high. Low-to-low I was expecting pullback for 20d low, which played out as sideways move and now the next 20d cycle is running. I expect to see similar M pattern like in Jan/Feb with the 20w cycle - right translated cycle the next one making slightly higher high and turning lower. So topping next week and decline into 40d cycle low.
The 20d lows are not so clear, most likely the 40d cycle is dominant and the sine wave follows slightly shorter 40d cycle.


Week 11 for the 20w cycle. Heading into 20w cycle high after that we should see a decline into 20w cycle low.


Tom Demark SEQUENTIAL AND COUNTDOWN - this technique spots areas of exhaustion.
The same price action like on the way lower - failed setup meaning no impulse followed by completed setup with histogram divergence.

Apr 11, 2020

Weekly preview

I think we have the expected a-b-c with the second leg higher this week.... and again it is developing very fast. I see two options the low comes one month earlier in May or this zig-zag is part of a bigger pattern for B. The second option feels better, but I can not predict it for sure in advance.
Short term I can only guess until we see more price action..... currently I think we will see a decline for 20d cycle low and one more high for 20w cycle high.

Here we go again - suddenly the experts bullish again - V-shape recovery, Avi Gilburt with impulse again one more chance before 4500:)))), the cycle guys with 20w or 40w low.... on the other side the bears with 1-2 and now 3 starting or at least much lower. I am the outcast again expecting something in the middle:)


TECHNICAL PICTURE and ELLIOTT WAVES
Short term - wave a hit 38% retracement and c 50%. Now we should see something lower. If we see impulse lower or more than 62% from c retraced(the red line) then for sure this leg up is over. The bullish case I can see is X wave and another zig-zag up(the green channel up). Neutral scenarios are bigger zig-zag lower for a flat or triangle. The bearish scenario is wave B finished and C to new lows begin.


Intermediate term - the minimum target 50% retracement has been reached. With a zig-zag there is a few possible options described above. We can only guess until we see the price action for another week or two. I think this move up should take more time so the green one or alternate the yellow scenario.


Long term - similar to the daily chart we have to wait for a while for the pattern to be revealed. No need to guess, I am just waiting patiently for late May/June to see how the situation looks like.


MARKET BREADTH INDICATORS
Market Breadth Indicators - some are showing extreme overbought levels which usually means strength, but I think it is early to talk about strong buy signal. More likely it is caused by extreme depressed levels before that.
McClellan Oscillator - extreme overbought.
McClellan Summation Index - buy signal.
Weekly Stochastic of the Summation Index - buy signal.
Bullish Percentage - extreme levels, buy signal.
Percent of Stocks above MA50 - waking up.
Fear Indicator VIX - expecting to see one more lower high for the VIX before the indexes complete the decline.
Advance-Decline Issues - still below the trend line connecting the highs since 2019 suggesting this should be just counter trend move.


HURST CYCLES
Daily(trading) cycle - buy signal, the price and RSI above the MAs. It was expected for the last two weeks, now it is obvious. From low-to-low we have 35 trading days, now we have 36 trading days high-to-high so do not fall in love with this buy signal.


Hurst cycles - I think wee should see a move lower for 20d cycle low and one more high for the 20w cycle high


Week 10 for the 20w cycle. Now expecting 20w high followed by move lower into the 20w/40w/18m cycle low.
Those who think this is 40w low - this is 100% wrong. The expert David Hickson switched to 20w low - only if we have some triangle.... more likely wrong too, making the same mistake like the EW guys - getting fooled by the amplitude. Cycle analysis is about time and not amplitude. Amplitude changed expanding since 2018, time has not changed.

Apr 4, 2020

Weekly preview

The first calm week. It looks like consolidation after the huge gains last week. The move lower looks corrective to me so the plan is the same - this should be b wave from retracement higher. Ideally this retracement should continue for at least another 2 weeks for 20w cycle high.


TECHNICAL PICTURE and ELLIOTT WAVES
Short term - we have flat 38% lower(w), there is no reversal so probably wave x is running... it looks like combination for b wave. Watching 50% Fibo retracement and c wave with the same size higher. This pattern fits well with time another week lower for 20 day cycle low and another week higher for 20w high. If it so bad we will see continuation lower red.


Intermediate term - nothing new, watching for gap close and test of MA200.


Long term - as long as the retracement stays below 62% the possible scenarios I see are:
- A-B-C for a huge expanded flat - this could be the price low, but it does not feel right as a pattern.
- W-X-Y - 2019 was X wave, what follows is another corrective pattern. Excluding flat - repeating March two more times looks crazy, so what is left is zig-zag(red) and triangle(yellow).


MARKET BREADTH INDICATORS
Market Breadth Indicators - trying to turn up with buy signals, but this is not a strong signal. The indicators are preparing for a divergences later.
McClellan Oscillator - around the zero line.
McClellan Summation Index - turned up with buy signal.
Weekly Stochastic of the Summation Index - turning up.
Bullish Percentage - wild swings.
Percent of Stocks above MA50 - trying to turn up, it will take time MA50 is far away.
Fear Indicator VIX - elevated levels. I think it should drop more before we see another surge higher.
Advance-Decline Issues - in the middle of the range around zero.


HURST CYCLES
Daily(trading) cycle - the price is trying to bounce from MA10 and brake above the second trend line, RSI will probably test the MA and the lower trend line before breaking higher. The trigger is buy, but as I said last week this should be just corrective move with one more leg up.


Hurst cycles - we saw 20 cycle high with length 16 days last week now we should see 20d cycle low next week. Ideally we should see two 20d cycles higher and the top of the second one should be the 20w cycle high.


Week 8 for the 20 week cycle. The 10w low looks confirmed, we should see a few weeks higher for 20w high and move lower into the 20w cycle low.