May 31, 2011

Short term update

The Indexes have broken the channel... and we have had the pullback as I have expected. Intra day pullback ~50%, nice entry point for those who were patient:)

The next moves - I expect something like this:

May 28, 2011

Weekly review / Седмичен преглед

I think the indexes are bottoming. Its difficult to predict the exact path for the short term. My 2 cents I think next week will see another push lower - higher low or lower low I do not know, but I think this will be a good entry point.
The other option is the indexes breaking decisively the down channel. In that case I would wait for some kind of pullback because you have higher risk and less profit.

My Intermediate term view stays the same - I think we will see marginal new high, the alternate scenario is lower high followed by sharp correction.

If I am right on my intermediate term call, the next several months will look like this:

May 21, 2011

Weekly review / Седмичен преглед

I think the correction is nearing its end. I expect a higher low followed by a move higher.
Another option is lower low but short living with divergence.

SP500 is finding support at EMA50 and the trend line. The correction is running for three weeks already without significant price retracement - less than 4%. A lot of overlapping moves - up and down, the histogram is working on its through low... This move looks like and feels like correction. Higher low or lower low the next move should be a rally to marginal new high.
The scenarios are shown bellow. Highest probability - move higher will follow.
Alternate scenario if we brake the trend line - we have already saw an intermediate term top.

May 14, 2011

Weekly review / Седмичен преглед

Lets see which way will the market choose next week ....

Longer term view

My longer term view is that a correction of higher degree is the next move.
Support levels - first level between ~11700 and ~11600 points second support level around 10750 points.
Weekly chart - MACD divergence and the Histogram triple divergence.
The Market breadth indicators are diverging - Bullish percentage, SPX500 Percentage of stocks above MA50, NYSE McClellan Summation index.
Look at the weekly chart of DJ hitting the upper trend channel... for fourth or fifth time. Ask yourself after such strong rise and this indicators do you expect the indexes to accelerate into even steeper channel breaking the upper channel boundary.
That is too much for me to be a bull for the next several months.

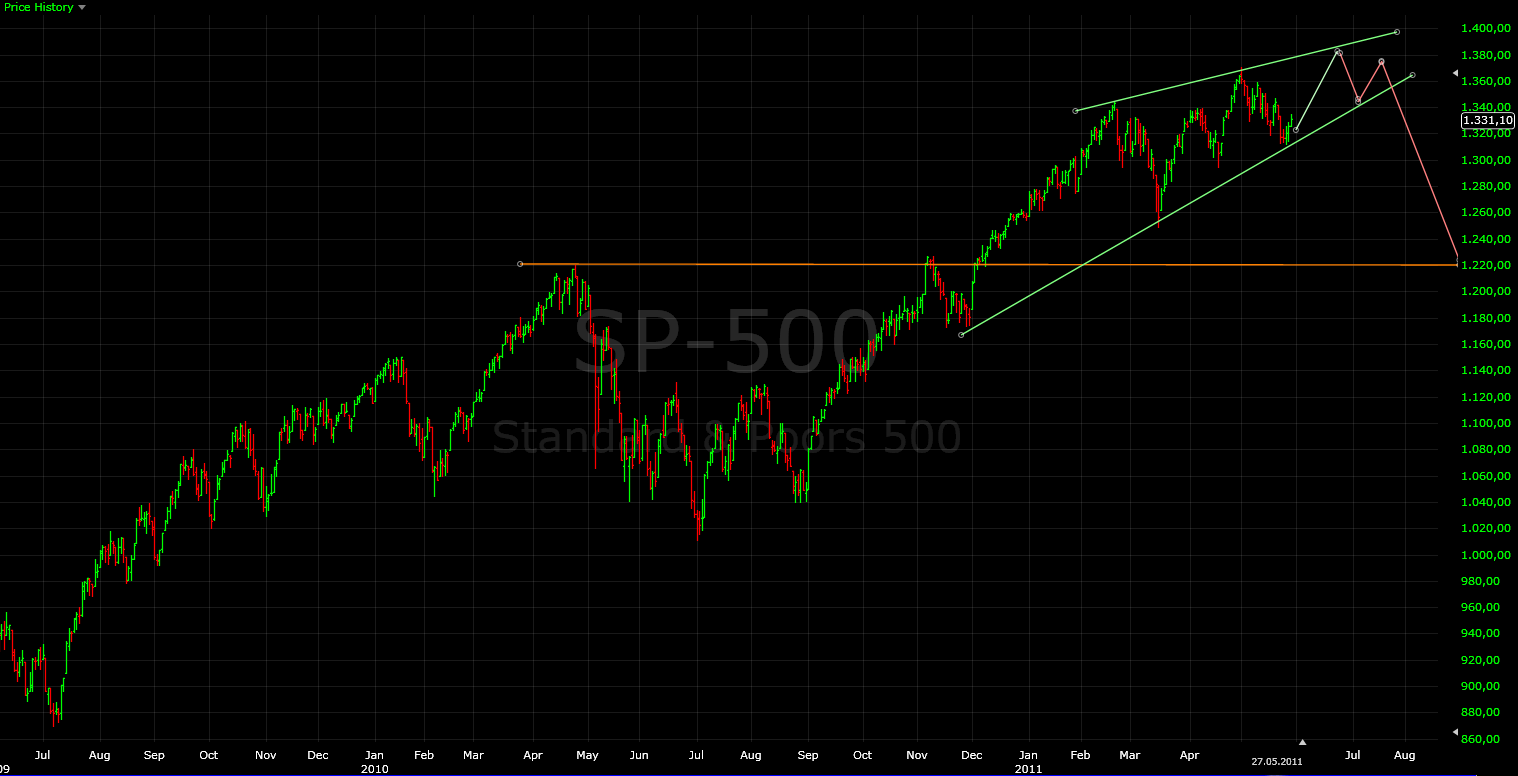
That does not mean the correction will start tomorrow. Topping takes usually some time. On the chart bellow I am showing to possible scenarios if we break the triangle on the upside or downside. I expect that we will see new marginal high, but scenario 2 is equally probable - look at the MACD and the Histogram pointing down. Let the market show us the direction next week.
If I am wrong we will continue crawling along the upper trend channel boundary on the weekly chart (scenario 3), but I personally will play the last move up so do not think I will miss something:)


May 11, 2011

Update

Scenario 2 is playing out. I still think that we will see higher high.

May 10, 2011

Update

Back from vacation:)
We saw higher prices as I have been expecting, but I see many TA signals raising red flags. I think the indexes are in a process of forming intermediate top and correction of bigger degree is the next move.

I expect new marginal highs followed by correction of bigger degree.
The difference between scenario 1 and 2 is actually only the path to new highs.
The other option is the indexes to continue climbing higher. I think this is less probable, watching the weekly charts and the market breadth indicators I do not like it very much. But who knows:)