Feb 22, 2019

Weekly preview

Nothing new this week - the indexes squeezed a few points higher (SP500 17 points from Friday) and reached serious resistance zone. I see some count it as impulse w1/V.... I see two legs up and so many shares and indexes with corrective patterns.... but market breadth says major low(thoughts in the comment section)!?!?
I will not forecast, I will just wait to see some kind of finished pattern for a high and what happens next - how the 20 week cycle low looks like. The first decline should be short living and it will be bought so no need to make decisions.


TECHNICAL PICTURE and ELLIOTT WAVES
Short term - the impulse count with green labels... I do not like it much. First RSI does not look like impulse more like two distinct legs and second the rally lasting 9 weeks already and wave 2 is only a few hours barely visible on RSI hourly... this does not feel right.
I see two legs higher with wave b in the middle and waiting now to see some kind of finished pattern.

RUT for example looks like this to me - two impulses for a zig-zag. Green 5 is where it corresponds to SP500 impulse... we will know soon, the next leg will show us which one it is.


Intermediate term - reached a zone which was a resistance for six highs on previous occasions. Impulse or not in both cases it seem it is time for a high.


Long term - wave B running for IV from 2009. If I am wrong it is an impulse and it is wave 1.


MARKET BREADTH INDICATORS
Market Breadth Indicators - double divergences for the oscillators like A/D line and the McClellan Oscillator. The trend following indicators are still pointing up. Expect short living pullback and higher, while market breadth building divergences.
McClellan Oscillator - triple divergences...
McClellan Summation Index - buy signal, very extended levels.
Weekly Stochastic of the Summation Index - buy signal, in overbought territory.
Bullish Percentage - reached the 70 level.
Percent of Stocks above MA50 - topping at very overbought levels.
Fear Indicator VIX - entering a zone where we should see a low.
Advance-Decline Issues - divergences no broad based advance anymore.


HURST CYCLES
Day 40 for the 40 day cycle. Into the timing band for a low and strong right translated cycle. This means the decline should be short living.


Week 9 for the 20 week cycle. The second option shown last week with shorter cycles.


Tom Demark SEQUENTIAL AND COUNTDOWN - this technique spots areas of exhaustion.
TD Sequence finished as expected now waiting for price flip.

Feb 16, 2019

Weekly preview

Instead of a pullback for 1-2 weeks and 40 day cycle low we saw another high. What changed - more divergences the oscillators with double divergences, the mainstream view impulse is dead, confirmed very very shallow and short b/B. It lasted only 6 days and less than 23,6%.... this is not how usually it behaves, but it is what it is. Everybody fooled counting w4... RSI was right again:)

Last week I wrote that I see some contradictions and I am confused... to sum it up:
- pullback for about a week needed to clear the oscillator divergences and 40 day cycle low.
- the next 40 day cycle should make higher high(explained last week), but after vertical first one it should not move much higher and the high should come earlier... like in middle of the cycle or earlier.
- Market breadth at very extended levels and it needs time to turn lower and build divergences. The price should move higher, but not in vertical manner.
- Impulsive pattern needed for c/B to finish the whole move from the December low. Usual extensions are 62% or 100%
- In a zig-zag a-b-c there is only one strong wave usually c, but if a is vertical c should be weak preferred 62% of a.
- Almost every share I looked at show clear corrective structure(explained last week) and namely mature and not like it just starting to accelerate higher.

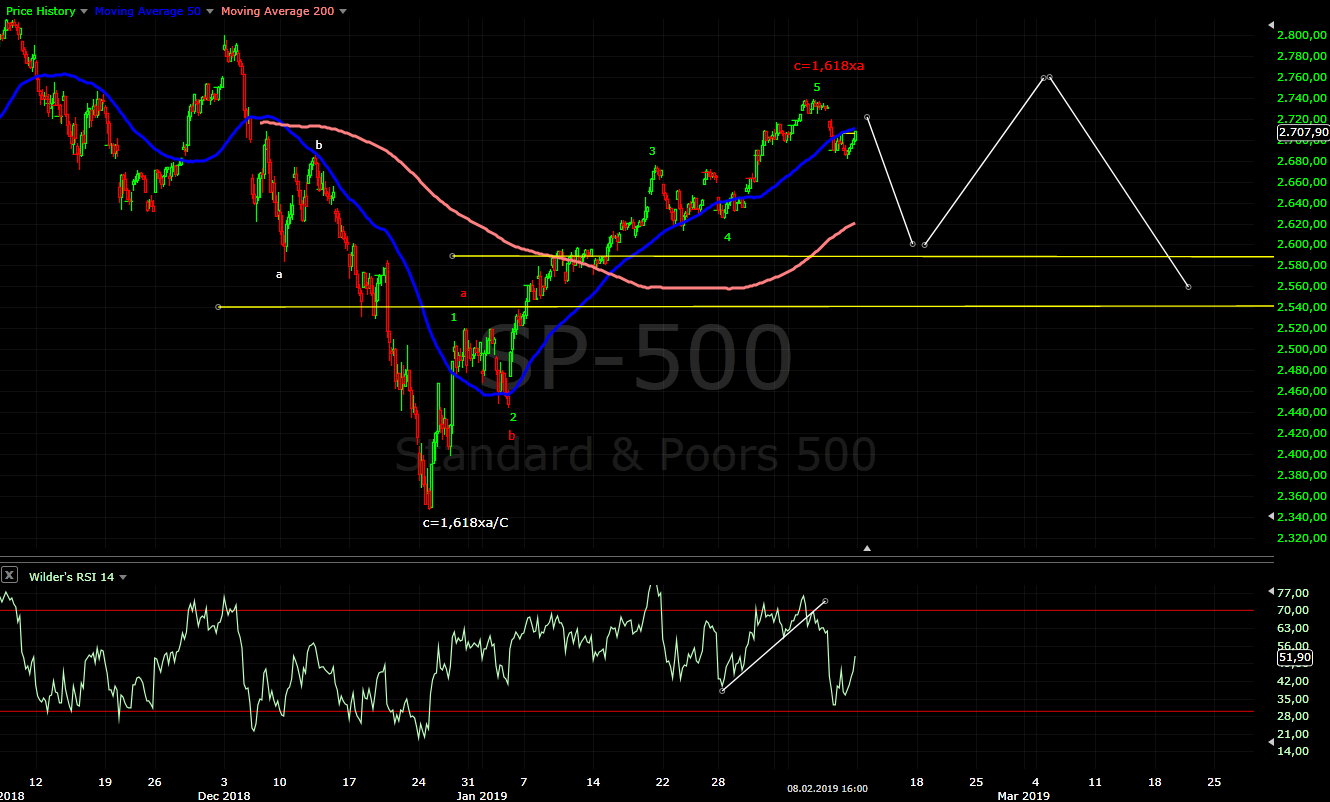
The pattern which will satisfy all this conditions with no contradictions is shown on the daily chart. It is of course speculative at this point and needs confirmation next week, but it fits the best. What are the alternative possibilities:
- bearish - smaller ED already w3 or w5. In this case we will have very weak c with very short b and most likely it is monster a/B and not B.
- bullish - 1-2 i-ii count and it just starting accelerate higher and parabolic up to 3000.... this will look very strange with the indicators and market breadth, not to mention after vertical wave "a" parabolic "c" to follow...... usually it does not work this way.


TECHNICAL PICTURE and ELLIOTT WAVES
Short term - this is what I expect currently quick pullback and higher.
A lot of discussion if we have an impulse or not. No it does not count well as impulse despite the visual similarities. I use RSI pattern and trend lines to verify counts - it works very well. An impulse usually looks like the count shown on RSI - overbought level for 3, break of the trend line 4, divergences 5. With very strong impulses the overbought level comes with iii/3 and the the indicator oscillate between 50-80 until the impulse is finished.
If it was an impulse the high should have been last week. Now it looks like two distinct moves with very shallow b.


Intermediate term - it is risky bet on ED:), but this pattern fits the best at the moment. Going from vertical to parabolic is too much for me:)


Long term - wave B running for IV from 2009.


MARKET BREADTH INDICATORS
Market Breadth Indicators - now double divergences for the oscillators like A/D line and the McClellan Oscillator. The trend following indicators are still pointing up. Expect short living pullback and higher while market breadth building divergences.
McClellan Oscillator - now double divergences.
McClellan Summation Index - buy signal, very extended levels.
Weekly Stochastic of the Summation Index - buy signal, in overbought territory.
Bullish Percentage - buy signal.
Percent of Stocks above MA50 - overbought levels, looks like short term topping.
Fear Indicator VIX - expect pop up higher.
Advance-Decline Issues - now double divergences.


HURST CYCLES
Day 36 for the 40 day cycle, it is getting extended so the decline should be sharp and quick followed by higher high.


Week 8 for the 20 week cycle. If I am right about c/B we have shorter 18 month cycles which I repeat for a while and the 4 year cycle will be later this year not in 2020.


Tom Demark SEQUENTIAL AND COUNTDOWN - this technique spots areas of exhaustion.
I will not be surprised to see open higher on Tuesday for finished countdown and reversal.

Feb 10, 2019

Weekly preview

Final squeeze up to finish fifth wave, MA200 daily/MA50 weekly were hit and we saw a reversal. The daily candles are not very convincing, but I think we have an impulse and the move lower has begun.
Market breadth is showing a lot of strength and we have strong right translated cycle so we should see shot living move lower(10 days) for 40 day cycle low. With such strength I expect sequence down/up/down 6-8 weeks to digest the vertical move up.

At the moment there is a few possible patterns quick sell off b/B and 1-2/C, more complex correction like flat/expanded flat b/B, or B is finished and wave C lower begins. I am in two minds whether we have a/B or B. On one side after such strength(breadth/cycles not price) we should see continuation higher. On the other side I see so many shares with finished zig-zag and theoretically another sell off should begin - for example EEM,SOX and shares from the tech sector... even BA(last chart) heavy weight blue chip showing so much strength. Despite that I will not be surprised seeing it smashed down 30% in the next 2-3 months.

There is no point to guess. We should just wait for the market to make it's next step, then we will have more information.


TECHNICAL PICTURE and ELLIOTT WAVES
Short term - I think we have impulse lower and the high should be tested with zig-zag. Then we should see some kind of down/up/down sequence for 20 week cycle low.


Intermediate term - MA200 hit and reversal, the histogram with divergence and RSI broke the trend line. Another rally higher looks unlikely. Probably the first leg lower will retrace 38% down to MA50 around 2600.


Long term - wave B running for IV from 2009. I am not sure if it is finished or there is one more leg higher.


MARKET BREADTH INDICATORS
Market Breadth Indicators - turned lower, but still buy signals and oscillators like A/D line and the McClellan Oscillator with divergences so we should see something lower, but short living.
McClellan Oscillator - double divergence and now close to the zero line.
McClellan Summation Index - buy signal.
Weekly Stochastic of the Summation Index - buy signal, but in overbought territory.
Bullish Percentage - buy signal.
Percent of Stocks above MA50 - overbought level and turned lower.
Fear Indicator VIX - should move higher for a while.
Advance-Decline Issues - turned lower after divergence.


HURST CYCLES
Day 31, we should see the indexes moving lower roughly week and a half-two weeks for 40 day cycle low.


Week 7 for the 20 week cycle. Shorter 18 month cycles possible with 4 year cycle low this year, so we will keep an eye how fast the pattern develops.


Boeing - one of the strongest shares. Despite that very likely corrective pattern like many other shares. Look at RSI - ziga-zag lower and zig-zag higher. Crazy pattern nested expanded flat(wave B) in expanded flat A-B-C, but waves and Fibo measurements so far are showing text book expanded flat. What I am saying do not underestimate the probability that B is over.

Feb 2, 2019

Weekly preview

Now we have pattern which looks complete retracing 61,8% close to MA200 and divergences on some indicators so I expect to see the indexes lower around mid-February. Market breadth is very strong and I do not think that wee will see just a plunge lower for b. I expect something more complex - lower until mid-February and retracing most of it early March. If I am right we will see one more decline to finish b/B.

Many are counting impulse, but I think we have a-b-c higher. There is so many shares with clear corrective structure and some indexes like SOX or DAX are clear zig-zags and not impulses. On the bearish side after 61,8% retracement with a zig-zag I will watch closely the next decline not to be surprised with finished B wave and C running. But I still think the more like scenario is a-b-c/B, because market breadth is showing too much strength.


TECHNICAL PICTURE and ELLIOTT WAVES
Short term - most of the EW guys are counting impulse green. For a real impulse I want to see one more w4(yellow) and 5. I think it is just a-b-c(red) RSI broke the trend line and testing it with divergence and this is a sign that the pattern is complete.


Intermediate term - It looks like wave a/B to me. Some expect lower low other continuation straight up... for me this scenarios have very low probability. I think we will see something like March 2018. Sell off, retracing most of it and another leg lower.


Long term - wave B running for IV from 2009. Possibilities are simple zig-zag or triangle to burn time.


MARKET BREADTH INDICATORS
Market Breadth Indicators - the big picture is positive buy signals, short term it is time for a pullback.
McClellan Oscillator - extreme followed by double divergences.
McClellan Summation Index - buy signal.
Weekly Stochastic of the Summation Index - buy signal in overbought territory.
Bullish Percentage - buy signal.
Percent of Stocks above MA50 - above 75 signaling strength.
Fear Indicator VIX - expect pop higher.
Advance-Decline Issues - divergences.


HURST CYCLES
Day 26 for the 40 day cycle. I think it will turn lower soon and 40 day cycle low mid-February.


Week 6 for the 20 week cycle. Shorter 18 month cycles possible with 4 year cycle low this year, so we will keep an eye how fast the pattern develops.