Jul 15, 2016

Long term - update

It is time for the next long term update and after that I am taking a break for a few weeks. The next update will be in August probably 07.08. Until than you will have to navigate the markets alone:)
P.S. The indexes reached the targets which I have posted. I am not comfortable on the long side anymore so I am out.... out on vacation:)


Since the last long term update I would say the markets moved in the expected direction no surprises - stocks higher, bonds higher, emerging markets outperforming, commodities with important low.
Last time I wrote - "trend changes are expected in 2016 based on my analysis of cycles and EW patterns."
Stocks made an important low and reversed, but the big questions are - Is the bond bull market over? Is the commodities bear market over?


What to expect in the future....
- Bonds major top of the bond bull market - 2012 for the 10-year treasury note and now for the 30-year treasury note, bold call but this is what the charts are saying they look very ugly for the bulls.
- Stocks - after the current mess is over continuation higher with the strongest wave 3 of the impulse probably fueled by money exiting the bond market.
- USD should finish the consolidation phase (probably a triangle) in the next 6 months with 3 year cycle low and start the final wave higher
The difficult part - is the bear market for commodities over after such impressive run?
- Gold miners look like an impulse, for gold/silver there is a lot of room for interpretation of the waves. For the next 6 months( before the next update) the rally should pause and correct. When we see the first move lower after this rally we will know more.
- Crude oil/Natgas - only three waves corrective move so far. If we do not see another leg higher for an impulse the energy sector is in some kind of corrective structure.


- STOCKS
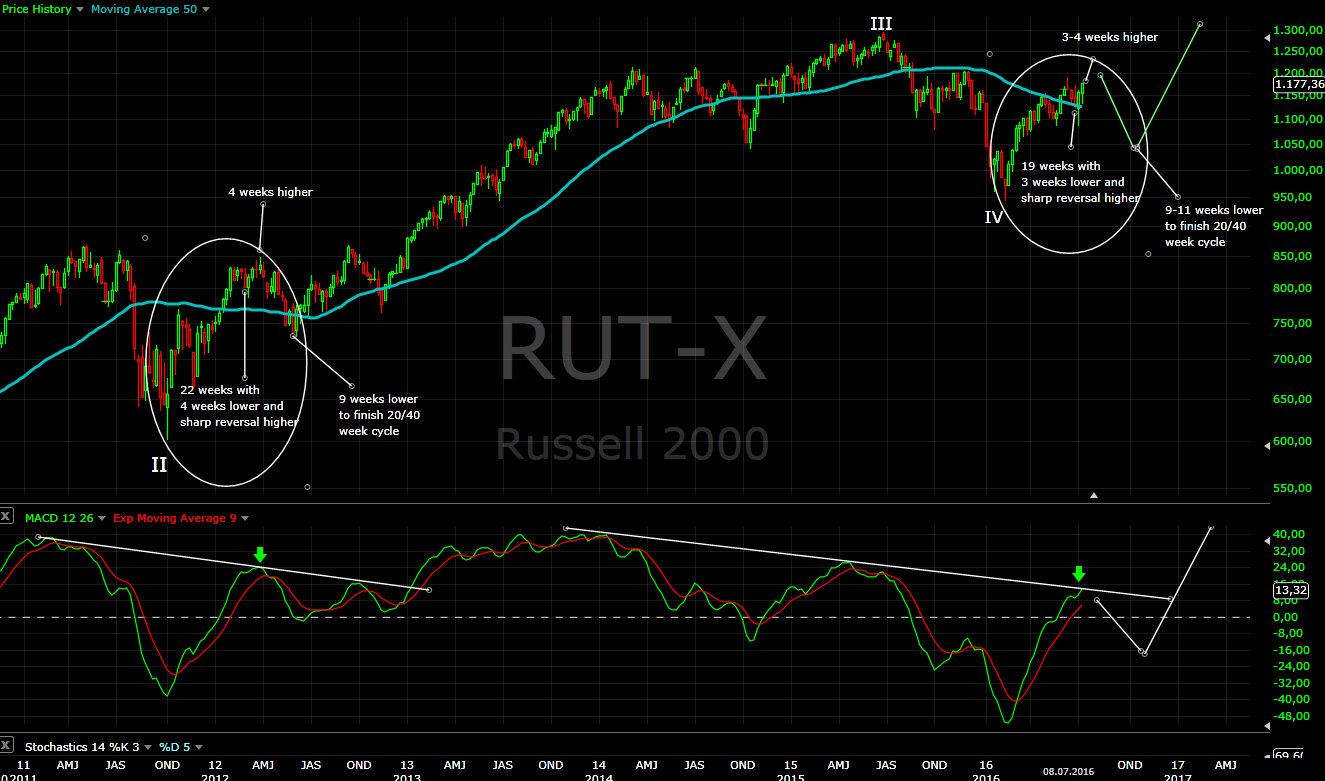
I had two scenarios - 7 year cycle low in Q1.2016 or October.2016. A few weeks after the February low I switched to the first one because the move was too strong and few months later we see SP500/DJ with new ATH. We have impulse higher and corrective move so more to the upside is expected.
Currently I expect the next important low for long term trade in October. I do not expect the end of the bull market before mid 2017.

The emerging markets had a strong leg higher as expected(because of commodities) and currently are in a correction before another leg higher.


- BONDS
I was expecting a move higher, but it is something completely different. I have found charts of the 10/30-Year Treasury Bond on one of my trading platforms... and now with the new information I am not surprised that I was wrong. The moves higher were not complete, but now the charts do not look very good for the bulls. I see only risk and profits which are not worth the risk anymore.


30-Year Treasury Bond two legs higher with correction in the middle A-B-C. Two 18 year cycles currently year 16 of the second one. Divergences on the monthly chart and price hitting the upper trend line. This is not something I would buy.

10-Year Treasury Bond - the same story EW,Cycles, TA indicators with the difference that the second leg higher C looks finished as an ending diagonal. We have an impulse lower already(a or 1) and zig-zag higher(b) for 30 months trying to retrace the initial sell off. It looks like double top to me.

TLT the same story huge ending diagonal hitting the upper trend line with divergences. Currently 2,5 years from an average 3,5 year cycle. Sorry bond bulls, but it is time to take profits.

30-years treasury yield - the average cycle length is between 5-6 years with only one outlier 7 years. So I thought in 2015 we have 6 year cycle with a nice low in the middle for half cycle, RSI extreme... well I was wrong it does not work perfect always. Now we have a cycle with 7 years length and divergences on the monthly chart. This time I do not expect surprises we should see strong rally higher and if the bond bull is over the next low should be a higher low somewhere in the support zone.


- FOREX
EUR/USD and DXY are corrective mess for 15 months already and it looks like a triangle. When it is finished we should see one final surge higher for the USD before a long term move lower.

For the DXY it can be an A-B-C for wave 4(we saw lower low in 2016), but the EUR/USD looks like a triangle and the next 3 year cycle low is in roughly 6 months so I think the consolidation phase should continue.

EUR/USD looks like a triangle and we need another year at least to finish 2,5/3 year cycle and the 8 year cycle(purple). The RSI trend line has been broken, which means the move higher from 03.2015 is reversing. The broken trend line should be tested for wave E of the triangle before the final plunge lower begins.

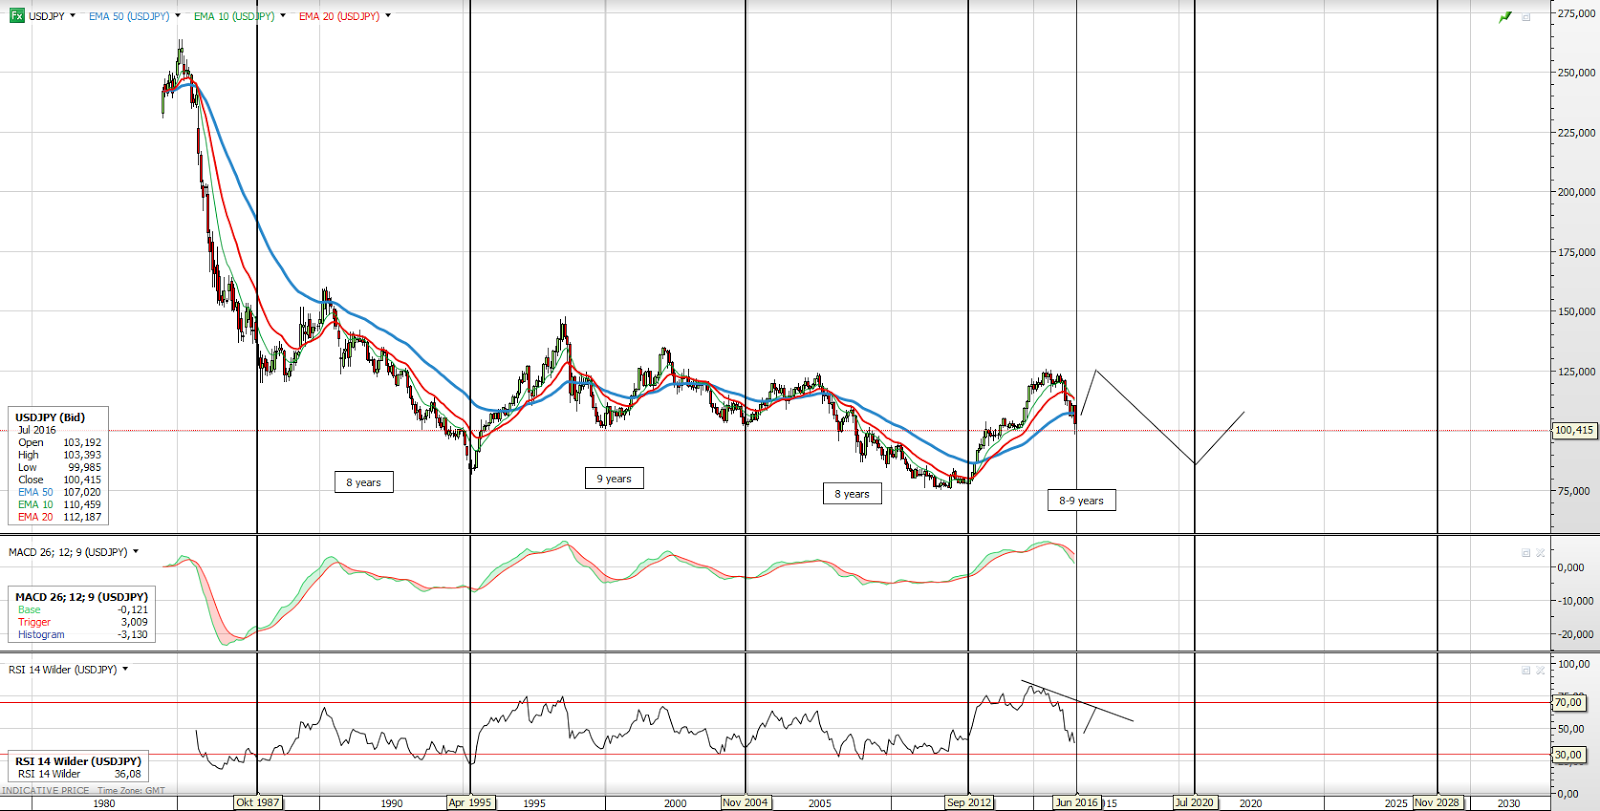
Last time I have shown cycle analysis of the tops for USD/JPY with clear 8-9 year cycle length. The topping cycle was in year 9 so I will not be surprised if the top is behind us. The move lower is deeper and longer as I have expected.
Now cycle analysis using bottoms - we have again 8-9 year cycle length and it looks like the yen is headed for a 4 year cycle low. After that one final move higher is expected for an M pattern followed by long term move lower.


- GOLD/SILVER/MINERS
Important low as expected and impressive rally for the gold miners. I find the precious metal sector the most difficult to predict. I lot of room for interpretation of the waves at the moment. We will be sure if a bull market has begun when we see the first leg lower.
Take more "practical" approach - I think the time for correction is coming so time to take profits. Than if we see corrective move it is bull market and load up again at lower prices, if we see something ugly it is bear market and you do not hold the bag... even can enter short at the right time. No need to guess at the moment.

The low came a few weeks earlier, but we have our important low. Gold entered in the resistance zone (cluster of highs between mid 2013 and mid 2015) and it is testing the down sloping trend line. I expect a top in the next few weeks and correction lower.

Everybody very bullish on gold, EW guys counting wave 3 to the moon..... I have shown on the chart all three possibilities which I see.
- The most bullish 1-2 (green count) and 3 to the moon - I do not think this is the right count.
- Impulse higher is finishing with ED for wave 5 (the yellow count) and correction should begin soon - this count looks ok (preferred at the moment).
- Bearish count A-B currently in C (red count) with new lows next year - it is possible if yields/stocks/USD make impressive run higher and money moves out of safe haven(gold). I can not predict this in advance with my knowledge and my system:) I need to see the leg lower first.

Silver with vertical move... the last article I saw was that the target for silver is 675:) Ooook at the moment I see only corrective A-B-C higher. You do not want to see such moves at the beginning of a bull market that is bad , but who knows maybe I am wrong and it continues vertically higher:)
It is not a problem to see gold with impulse(see above) and silver with corrective zig-zag. In 1999-2001 the previous important low exactly that happened - gold made higher low and silver lower low.

Not very clear count.. It is more likely that we have an impulse and correction will follow.


- CRUDE OIL/NATGAS
Important lows as expected and impressive run, but the moves higher are only three waves so far which is corrective.
The current move lower - we do not see impressive impulsive reversal from the ED(wave c), the XLE index looks like an impulse higher and corrective phase running, the same for the Emerging markets, a lot of energy companies with impulses higher, USD/RUB with impulse lower so after a pause the RUB should continue higher against the USD. The signs at the moment are for a corrective leg lower from a bigger corrective structure higher.
And the question if this is a new bull market? Like precious metals no need to guess a year in advance just let the moves play out than we will see.

At the moment we have two legs higher with the same size and the second leg looks like ED. The odds are much higher that we have corrective leg a-b-c than impulse.

At the moment the red bearish count looks more likely. The waves and cycles fit better. It will not be a surprise to see crude oil rising into 2017 and than plunge lower one more time in sync with stocks.

NATGAS surprised me with one more leg lower, but this did not change the big picture. The 18 month and 4 year cycle just came a few weeks later.
The same story like crude oil - so far we have only three waves higher and week 18 it is time for a pause and correction.

Jul 14, 2016

Update - the bullish scenario

I was asked "What would trigger you to change your view?" - and my answer is:
- if I see an impulse higher - the markets should rally well above 2200.
- indicators/market breadth - making higher highs and clear the divergences or reset lower with market hanging around burning time with a sideway move.


Current conditions two impulses higher with the same size(only zig-zag so far), market breadth at overbought levels with divergences.
Now trying to look all this with bullish glasses - two scenarios the indexes continue higher so that we have an impulse(green) market breadth clears the divergences, or this zig-zag is part of a diagonal(light green) and market breadth reset lower while the markets moving sideways.
A move does not end with three waves higher so the only bearish scenario at the moment is that this is wave B of ugly expanded flat correction(my last forecast).

To be honest I like this diagonal scenario - it does not look so ugly like the expanded flat, cycles will look perfect, and with high probability market breadth will reset lower to levels I want to see... all conditions met. If you are bullish you do not want to see the green path this is not a healthy behavior.

And the chart visually how bullish moves should look like. After 2-3 weeks the picture should be clear what is going on... exactly when I am back from holiday:)
P.S.The blue lines is the area(2075-2100) where the very bullish scenario(green) is dead.

Jul 12, 2016

Update - the bearish scenario

Russell2000 has the most clear picture for this correction... the correction which makes new ATH:) The alternate scenario is the indexes continue vertically higher to clear the divergences which are building.

Waiting for wave iv of c of B

I think we have expanded flat with target 1205-1215 for B than lower to the support zone.

Similar picture for SP500 the two targets for the expanded flat are 2150 and 2168. The second looks more probable.

Similar picture for the DAX waiting for iv and v of c of B

Jul 9, 2016

Weekly preview

Short term view - the ATH should be tested.
Intermediate term view - another week or two higher than lower.

The pullback began promising the leg lower was looking like impulse and than another move higher instead of a second leg to finish a pullback. I would not say it is bullish behavior not letting the market to correct.

I do not know what this messy pattern is. It is corrective so forget about bear market, but I do not think this is wave 3 either. For me the charts does not look right for a buy signal and long lasting rally. This rally will fail - risking to be wrong and miss the beginning of wave 3 so be it.


TECHNICAL PICTURE and ELLIOTT WAVES
Short term - no clue what the pattern is. We will know in hindsight, which means with very high probability it is corrective pattern.


Intermediate term - will the price go vertically higher or test the trend line and ATH one more time before the second part of the correction begins? I think it is the second. If you are a bull pray for the second. Markets moving vertically are not sustainable and exhaust too fast.


Long term - the same story... will the indicators correct or move vertically higher?


MARKET BREADTH INDICATORS
The Market Breadth Indicators - I do not see any signs for important low just short term bottom. I think we will see the indexes crawling higher for another 1-2 weeks and market breadth building divergences.
McClellan Oscillator - spending time above zero.
McClellan Summation Index - buy signal level around 900... and where will wave 3 end if it has just begun at 3000????
Weekly Stochastic of the Summation Index - buy signal in he middle of the range.
Bullish Percentage - buy signal.
Percent of Stocks above MA50 - close to the upper level 75.
Fear Indicator VIX - at 13 complacency levels again.
Advance-Decline Issues - making lower highs.


HURST CYCLES
Day 8 of the 40 day cycle.

Week 2 of the current 20 week cycle.


This is what I think is going on. This is comparison between wave III and V - how they are moving after the end of wave II and IV.
Wave III - 22 weeks cycle with 4 weeks lower. The next cycle began with sharp reversal and moved 4 weeks higher before turning lower for 9 weeks.
Wave V - 19 weeks cycle with 3 weeks lower. The next cycle began with sharp reversal and 2 weeks higher so far.
I think we will see another week or two before this rally is over and a decline for 2-3 months to finish 40 week cycle.

Jul 3, 2016

Weekly preview

Short term view - pullback to begin next week.
Intermediate term view - a few weeks higher.

I was expecting impulse lower for a few days to finish expanded flat with measurements 1982 and 1993 and possible surprise on Monday. What happened - expanded flat(was it a flat??) finished with only three waves, target hit 1991 and the "surprise" reversal was on Tuesday. Very close to the forecast, but as always extremely difficult to predict the exact path and to trade it. At least we knew not to go long at the top before Brexit and short at the low after the news.

Now is this the bottom of wave 2 and the beginning of the next bullish leg higher? Looking at the charts they do not look ready for wave 3.
Cycles, TA indicators, Market breadth does not look ready for a 25% rally for at least 6 months. TA indicators has not been reset, Market breadth no signs of an important low, and time(cycle) if this is wave i of 3 of V how long it will last to finish V? The end of the year? The bull market should continue another 12-18 months at least not another 6 months.
For bullish vertical moves is valid the same like for bearish - you need depressed levels time and/or price and vertical move giving birth of a new trend. If this conditions are not met the move is unsustainable and it exhausts the buyers too fast. Two day vertically lower and 4 days vertically higher qualify as volatility caused by an event/news, short sellers covering and momentum traders riding it.

Keep in mind what I wrote above, but this is a case where trading takes precedence over analysis. DO NOT TRADE 2-3 STEPS AHEAD OF THE MARKET. Do not to try to outsmart it trade step by step following the market. I keep it simple - we have a strong move higher which looks like an impulse and if we see corrective move lower it is a buying opportunity. Than we watch if the rally fails or not. We have a strong move from a 20 week cycle low so it should last 3-4 weeks it will not just reverse lower.


TECHNICAL PICTURE and ELLIOTT WAVES
Short term - the move higher looks like impulse so a pullback and another move higher is expected.


Intermediate term - the target was hit, 38,2% Fibo hit, reversal from the support zone - is not a surprise that we saw a bottom.


Long term - no change. When the correction is over wave 3 should begin. I can not say if it has begun or not but the price is finding support at MA50 and as long it stays above it is bullish price action.


MARKET BREADTH INDICATORS
The Market Breadth Indicators - some oscillators are pointing to a bottom as it should be, we have a-b-c correction finished, other indicators have stayed at elevated levels no signs of resetting at all. I do not see signs for an important low. If this is wave 3 it should move vertically higher when the indicators are useless... and this does not fit with seasonality and cycles.
McClellan Oscillator - higher lows at levels where you see short term bottoms.
McClellan Summation Index - buy signal above 700 no signs of retracement at all.
Weekly Stochastic of the Summation Index - too much volatility for a weekly indicator.
Bullish Percentage - in the middle of the range, at levels where you see short term bottoms.
Percent of Stocks above MA50 - hit the lower range a sign for a short term bottom at least.
Fear Indicator VIX - hit 27 where correction find bottom.
Advance-Decline Issues - moved only to the middle of the range.
NYSE New Highs-New Lows - one of the highest levels since the bull market begun.


HURST CYCLES
With this sharp sell off and reversal the odds are much higher that this is the 20 week cycle low with length 19 weeks and the 40 week cycle low is pushed a few weeks later in the first half of October.

The cycles adjusted accordingly - the next 40 day cycle is running at day 4.

The next 20 week cycle is running at week 1.


I think the next important bottom will come as usual in October period. We will know later if I am right. First we need to see a pullback and weak second leg higher for the current move only than we watch this charts.

McClellan Oscillator is one of the greatest market breadth indicators. The blue ellipse is wave III(the strongest) of this bull market and the red circles mark the lows of internal waves of different degree. For corrections of lower degree we see the McClellan Oscillator around 0 and correction of bigger degree move from -400 to -600. Than the next bullish leg moves to the 1000-1200 area. The current correction moved to.... 700 and this should be important low????? How high should it move if we are in wave 3 - 2000?? forget it. I think we will see the same like the black circles a second top and move lower to at least the zero line.

Emerging markets - the pattern looks the same like the US indexes(impulse and correction) but more clear shape. EEM the first leg lower is an impulse and the leg higher corrective which means to expect more to the downside.

Nasdaq

Russell2000 H&S with two left and right shoulders.

NYSE - February was a higher low and this is an alternate count with correction which begun with Brexit.

DAX - corrective mess. Before Brexit we had a-b-c lower than rally just before the news probably wave B and another a-b-c is running.

SP500 speculative pattern at the moment. Maybe the expanding flat is much bigger.