
Dec 27, 2014
Update
Last week SP500 closed above 2060 and the bearish weekly candle was negated. Now back to the idea for marginal new high before a bigger correction. The alternate scenario is blow off phase... personally I do not think that we will see such move when everybody is on one side of the boat.
Watch the price action - if I am right in the next weeks we should see a higher high with divergence and the price breaking below 2060... ideally we should see some indexes like DAX and NYSE not confirming the new highs.
If you are a super bullish support should hold and another strong move above 2100 should follow.

Dec 19, 2014
Happy holidays!!!!
Happy holidays!!!!!
The next weekly review will be posted on 10-11 January.
Currently - the move up and how high it moved is not a surprise, you can see the last post, but for two todays.... yeah completely normal market... really:)
If you think the US indexes are volatile... I am trading the DAX it is like on steroids in the last months moving 10%-20% just like that.... it is crazy.
With this volatility when one side gives up eventually we will see either sharp correction or a blow off phase... great forecast:))))
As long as the price stays below the last high the plan stays the same. Looking at the scary huge bars you can only think of a new high... if the indexes continue to move this way as an impulse above the high I can think of only that the blow off phase has begun. The next 1-2 weeks will show us what is going on.
Dec 17, 2014
Update
The bulls have failed as expected. The move looks like an impulse now on the DAX and SP500. After an impulse the next move should be only corrective and make a lower high.
Today is FOMC which usually marks a top/bottom. The charts and indicators look good for a short term bottom
I have forgotten about the comparison with August-October 2007.... It moves the same way so far - sharp and short living 10% correction, sharp rally higher with marginal new high, first drop lower...
if it continue to mirror this move next is deep retracement - perfect opportunity to get rid of longs and go short. The charts are pointing to exactly this scenario so far.
This looks like an impulse to me.... a little bit up and down before FOMC for a short term bottom.
 We should see a short term bottom around 38,2% and rally to the resistance area.


Dec 14, 2014
Long term
I have wrote already something about the long term when I have posted a chart of EEM. Here are several more charts with a little bit more thoughts. At the end of the year to step back and look at the big picture where we are.
Short said I expect deep correction something like 15% for 2-3 months before final blow off.
- some thoughts - it looks to me like a "controlled market". I am not buying it that the economy is doing great. When will it peak? When they lose control - huge final blow off or it is time to let it go - start raising rates. The world is drowning in debt and if they raise the rates it is game over. It will not happen unless the market force them and the CBs lose the battle against mother nature:) or you can believe that the economy is doing great....
We are not there yet and any weakness will lead to a countermeasures from the CBs.
- Elliot waves - from the charts bellow it looks to me that any move lower will be just a correction, from higher degree but a correction. DAX looks like flat to me, Russell 2000 similar pattern, EEM wave C lower expected, DJT wave 4 expected. The major indexes SP500 and DJ does not have so clear picture, but when I look at other indexes they all say the same to me - expect corrective move of a higher degree.
- Cycles - they can not tell you we hit a top, but they are telling us when we see a top the move lower should be of a bigger degree. Given the huge weekly bar I would say the current 20 week cycle has topped out. This is the third one of four 20 week cycles for the 18 month cycle. It is too early to say the 40 week and 18 month cycles topped out, but when I look at the other indexes there is high probability that it already happened.
I am not a long term trader so if I am wrong that will not hurt me, but to have a complete road map lets see what are the other options if I am wrong:
- this is the top of the bull market - what we see on the DAX and Russell 2000 is topping pattern similar to 2007 the SP500 and DJI are stronger but they top too.. some kind of a wedge. This scenario will not be so bad because you are on the right side anyway.
How to make difference between the two scenarios? - the difference is time. The corrections in a bull market are sharp but short living 40-50 days, the first move after reversal lasts longer 70 days or more. If we see a bottom in March or before that it is just a correction. If we see a bottom in May or later I will bet that a bear market has begun.
- final blow off has begun - the correction in October was probably wave 4, DAX and Russel200 finished their corrections with the first a-b-c lower. Than we should see max 50% retracement to around 1950, corrective move some kind of wave 2 and another huge rally.
In this case watch closely how the indexes move lower impulses or three waves and you have to be flexible to switch between short/long...
DJTA - it shows clear impulse for me. RSI divergences at the end of wave 3. Support and 38,2% Fibo point to the same area around the low for the previous wave 4 of 3... everything fits perfect.
Cycles - the red arrows are 18 month lows with length 60-70 weeks and blue arrows 40 week cycle lows. Currently we are at week 46 or roughly 3/4 of the 18 month cycle is behind us. It is logical to expect the last 1/4 to be a move lower.
 The DAX have 3 waves lower 3 waves higher. Is it an impulse? - no. 3-3-? which pattern is this? - flat correction 3-3-5 impulse lower should follow.
Cycles - week 40 of the 18 month cycle - average length 60-70 weeks. The 18 month cycle has reached roughly 2/3 of it's length.
The DAX have 3 waves lower 3 waves higher. Is it an impulse? - no. 3-3-? which pattern is this? - flat correction 3-3-5 impulse lower should follow.
Cycles - week 40 of the 18 month cycle - average length 60-70 weeks. The 18 month cycle has reached roughly 2/3 of it's length.
 Russel 2000 the same pattern as the DAX. The first move lower is corrective 3 waves. We have either finished correction or it is part of a bigger corrective move.
 EEM has already begun wave 3 lower. It think we are nearing the bottom of wave 1 of 3. Wave 2 of 3 on EEM and some retracement on the major indexes during the holidays will synchronize the moves.


Dec 13, 2014
Weekly review
Short term view - 1-2 days bottoming before a relief move higher.
Intermediate term view - I think a multi month move lower has begun.
We have a top, but I was expecting the move to develop differently - 2-3 weeks topping up and down during the holidays... the huge candle on the weekly charts says a move lower has begun. I do not know if it is because of the crashing energy sector, but I think the intermediate term correction which I was expecting in Q1 2015 has begun.
Short term - we are nearing oversold levels on different indicators and markets... probably 1-2 days before we see a short term bottom. The next move up will show us if I am right, but I think it will be a lower high. The alternate scenario is the indexes to continue plunging lower... usually that does not happen at this time of the year and when they are above MA50. It is more logical to see a relief move higher during the holidays. Plus Crude oil, EEM and energy sector look oversold - XLE it looks to me like 5 waves lower with MACD divergence.
Long term - I will post something about the long term later.
- EW - is not very clear on the major indexes, but indexes like DAX and EEM looks like wave C lower has begun. We should see a similar move on the SP500 and DJIA. I will post later charts.
- Cycles - top of the 20 week cycle. This is the third from four 20 week cycles of the 18 month cycle. That means a high probability that the 40 week and 18 month cycle topped out too.
- Technicals - huge weekly bar wiping out the previous 5 weeks gains. Huge bars appear near or at the beginning/the end of a move. It is not the end of a move it has just started:) Plus the MACD divergences which we see for a long time.
- TomDemark - failed setup and price flip on the weekly chart.
- Market breadth - support an intermediate move lower.
- Reversal in different markets - the energy sector is crashing, emerging markets look bad EEM has started it's wave three lower and more important I think major currencies USD/EUR USD/JPY are reversing. The market's dynamic is changing....
My conclusion - we should see a correction for 2-3 months, not a surprise it has just arrived 2-3 weeks earlier. As I wrote it was a good idea to take profits and unfortunately the holidays will not be as calm as expected. The next high will be a opportunity to sell longs if you have some and enter short positions.
TECHNICAL PICTURE
Short term - waiting for a short term bottom and relief move higher. When I look at different markets I think we should see a lower high(red).
So far it could be A-B-C (the alternate scenario green) but it will have a chance only if we see a strong reversal next week and a move to at least 2060 so that the huge bar is negated.

Intermediate term - at support and MA50 as expected... I think we will see a bounce but the green scenario is now the preferred one.

Long term - no change, moving as expected.

MARKET BREADTH INDICATORS
The Market Breadth Indicators - short term bottom is expected, long term the indicators are saying a move lower has begun.
McClellan Oscillator - near oversold levels and outside the BB. Usually that means a bounce - small bounce and lower low on the indexes before a short term bottom?
McClellan Summation Index - sell signal.
Weekly Stochastic of the Summation Index - sell signal.
Bullish Percentage - sell signal with long term divergence.
Percent of Stocks above MA50 - sell signal moved bellow 75.
Fear Indicator VIX - huge spike. I told you expect the volatility to rise, but I did not expect to happen so soon.
Advance-Decline Issues - nearing the oversold level, but not there yet.
Percent of Stocks above MA200 - ugly, only at 45%, we know the internals are weak.
HURST CYCLES
41 days for the current 40 day cycle... we should see a bottom soon.
I think we saw the top of the current 20 week cycle. This is the third from four 20 week cycles of the 18 month cycle. That means there is a high probability that the 40 week and 18 month cycle topped out too.
Tom Demark SEQUENTIAL AND COUNTDOWN - this technique spots areas of exhaustion.
Failed setup and price flip on the weekly chart. After finished sequence a setup is running day 5.
Intermediate term view - I think a multi month move lower has begun.
We have a top, but I was expecting the move to develop differently - 2-3 weeks topping up and down during the holidays... the huge candle on the weekly charts says a move lower has begun. I do not know if it is because of the crashing energy sector, but I think the intermediate term correction which I was expecting in Q1 2015 has begun.
Short term - we are nearing oversold levels on different indicators and markets... probably 1-2 days before we see a short term bottom. The next move up will show us if I am right, but I think it will be a lower high. The alternate scenario is the indexes to continue plunging lower... usually that does not happen at this time of the year and when they are above MA50. It is more logical to see a relief move higher during the holidays. Plus Crude oil, EEM and energy sector look oversold - XLE it looks to me like 5 waves lower with MACD divergence.
Long term - I will post something about the long term later.
- EW - is not very clear on the major indexes, but indexes like DAX and EEM looks like wave C lower has begun. We should see a similar move on the SP500 and DJIA. I will post later charts.
- Cycles - top of the 20 week cycle. This is the third from four 20 week cycles of the 18 month cycle. That means a high probability that the 40 week and 18 month cycle topped out too.
- Technicals - huge weekly bar wiping out the previous 5 weeks gains. Huge bars appear near or at the beginning/the end of a move. It is not the end of a move it has just started:) Plus the MACD divergences which we see for a long time.
- TomDemark - failed setup and price flip on the weekly chart.
- Market breadth - support an intermediate move lower.
- Reversal in different markets - the energy sector is crashing, emerging markets look bad EEM has started it's wave three lower and more important I think major currencies USD/EUR USD/JPY are reversing. The market's dynamic is changing....
My conclusion - we should see a correction for 2-3 months, not a surprise it has just arrived 2-3 weeks earlier. As I wrote it was a good idea to take profits and unfortunately the holidays will not be as calm as expected. The next high will be a opportunity to sell longs if you have some and enter short positions.
TECHNICAL PICTURE
Short term - waiting for a short term bottom and relief move higher. When I look at different markets I think we should see a lower high(red).
So far it could be A-B-C (the alternate scenario green) but it will have a chance only if we see a strong reversal next week and a move to at least 2060 so that the huge bar is negated.

Intermediate term - at support and MA50 as expected... I think we will see a bounce but the green scenario is now the preferred one.

Long term - no change, moving as expected.

MARKET BREADTH INDICATORS
The Market Breadth Indicators - short term bottom is expected, long term the indicators are saying a move lower has begun.
McClellan Oscillator - near oversold levels and outside the BB. Usually that means a bounce - small bounce and lower low on the indexes before a short term bottom?
McClellan Summation Index - sell signal.
Weekly Stochastic of the Summation Index - sell signal.
Bullish Percentage - sell signal with long term divergence.
Percent of Stocks above MA50 - sell signal moved bellow 75.
Fear Indicator VIX - huge spike. I told you expect the volatility to rise, but I did not expect to happen so soon.
Advance-Decline Issues - nearing the oversold level, but not there yet.
Percent of Stocks above MA200 - ugly, only at 45%, we know the internals are weak.
HURST CYCLES
41 days for the current 40 day cycle... we should see a bottom soon.

I think we saw the top of the current 20 week cycle. This is the third from four 20 week cycles of the 18 month cycle. That means there is a high probability that the 40 week and 18 month cycle topped out too.

Tom Demark SEQUENTIAL AND COUNTDOWN - this technique spots areas of exhaustion.
Failed setup and price flip on the weekly chart. After finished sequence a setup is running day 5.

Dec 9, 2014
Update
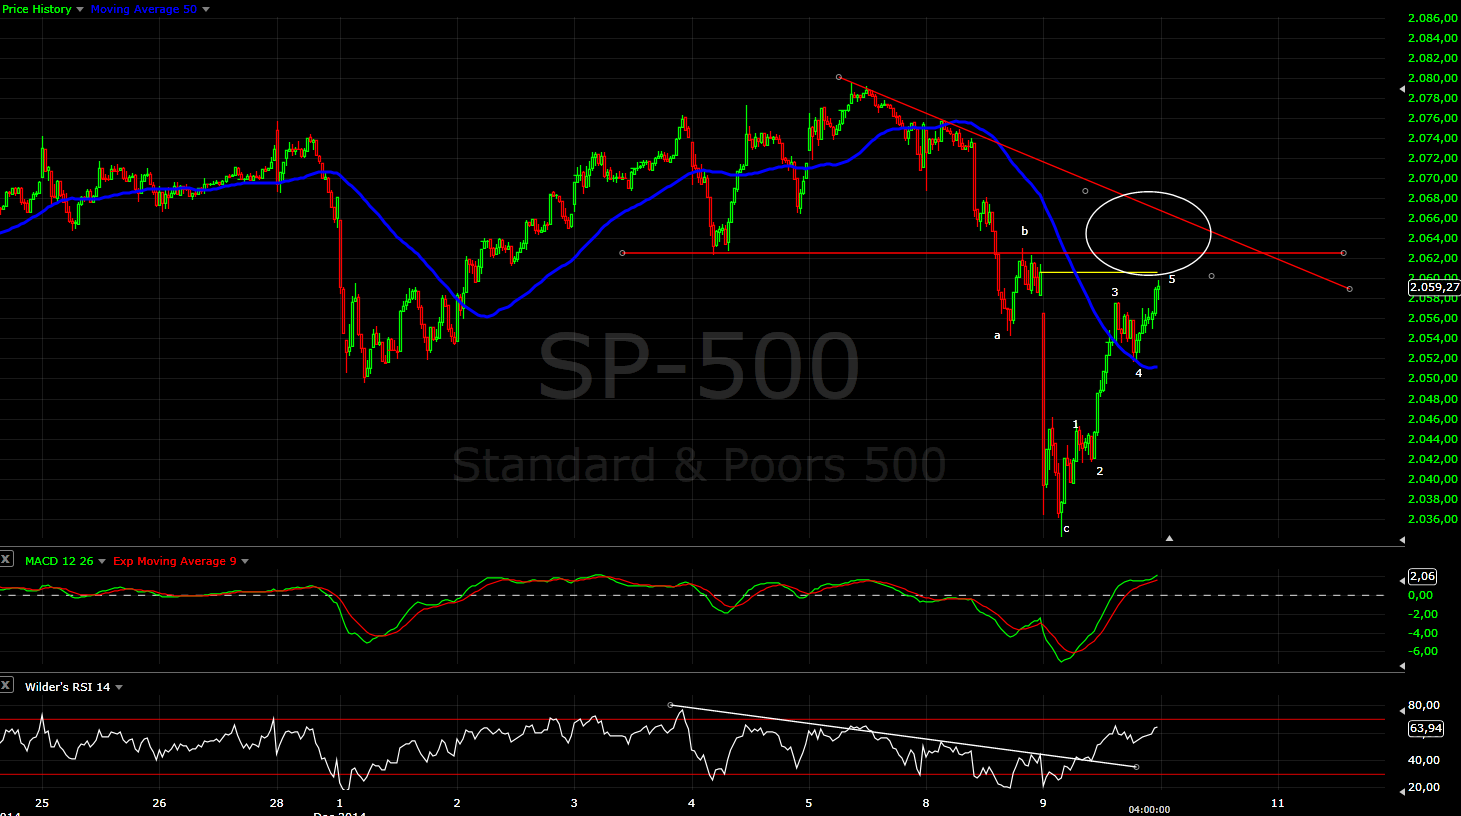
As expected lower to the support level 2040(overshot with several points) and reaction higher. The bad news for the bears the move lower is corrective and the move higher looks impulsive. Now even another higher high is possible.
Around 2065 there is resistance and MA50 from the hourly chart and I expect reaction lower but I think another move higher should follow.
 The price action makes me think that we will see some choppy moves up and down for the rest of the month.... something similar like on the chart bellow.


Dec 6, 2014
Weekly review
Short term view - we should see a pullback next week.
Intermediate term view - pullback after a short term top and another move higher.
The indexes continue crawling higher after 25 points drop, but nothing really worth mentioning.... boring week overall.
The same charts updated...
TECHNICAL PICTURE
Short term - if you zoom and look at the shorter time frames it looks like one final push higher is left, but it should be short living. You see where the confirmation is for a something to the downside - around 2060.
Than a pullback should begin....
Intermediate term - nothing new... alternate scenario we will see the top next week and subsequent "Christmas rally" will only test the top(green). But first I want to see a move bellow 2000 to think about the alternate scenario.

Long term - I will post extra something about the long term...

MARKET BREADTH INDICATORS
The Market Breadth Indicators - the same like last week. A lot of divergences, a pullback is due, no major sell signals for now.
McClellan Oscillator - bellow the zero, ignoring up moves.
McClellan Summation Index - still buy signal, but ready to cross bellow the MA.
Weekly Stochastic of the Summation Index - sell signal. This swing is near it's end. That does not exclude another push higher end of December early January.
Bullish Percentage - buy signal.
Percent of Stocks above MA50 - small divergence... pullback.
Fear Indicator VIX - BB are again very close... expect the volatility rise probably after the holidays.
Advance-Decline Issues - cumulative AD starts diverging...
NYSE New Highs-New Lows - lower high and divergence.
Percent of Stocks above MA200 - only 54% above MA200 on ATH... weak internals.
HURST CYCLES
Day 36 of the current 40 day cycle. I think next week we should see a move lower.
Week 8 of the current 20 week and 40 week cycle. Cycles continue to support the plan so far.
Tom Demark SEQUENTIAL AND COUNTDOWN - this technique spots areas of exhaustion.
Daily chart nothing new. Weekly chart - we have week 6 of a setup. The completion of a setup will fit the plan perfect.
Intermediate term view - pullback after a short term top and another move higher.
The indexes continue crawling higher after 25 points drop, but nothing really worth mentioning.... boring week overall.
The same charts updated...
TECHNICAL PICTURE
Short term - if you zoom and look at the shorter time frames it looks like one final push higher is left, but it should be short living. You see where the confirmation is for a something to the downside - around 2060.

Than a pullback should begin....

Intermediate term - nothing new... alternate scenario we will see the top next week and subsequent "Christmas rally" will only test the top(green). But first I want to see a move bellow 2000 to think about the alternate scenario.

Long term - I will post extra something about the long term...

MARKET BREADTH INDICATORS
The Market Breadth Indicators - the same like last week. A lot of divergences, a pullback is due, no major sell signals for now.
McClellan Oscillator - bellow the zero, ignoring up moves.
McClellan Summation Index - still buy signal, but ready to cross bellow the MA.
Weekly Stochastic of the Summation Index - sell signal. This swing is near it's end. That does not exclude another push higher end of December early January.
Bullish Percentage - buy signal.
Percent of Stocks above MA50 - small divergence... pullback.
Fear Indicator VIX - BB are again very close... expect the volatility rise probably after the holidays.
Advance-Decline Issues - cumulative AD starts diverging...
NYSE New Highs-New Lows - lower high and divergence.
Percent of Stocks above MA200 - only 54% above MA200 on ATH... weak internals.
HURST CYCLES
Day 36 of the current 40 day cycle. I think next week we should see a move lower.

Week 8 of the current 20 week and 40 week cycle. Cycles continue to support the plan so far.

Tom Demark SEQUENTIAL AND COUNTDOWN - this technique spots areas of exhaustion.
Daily chart nothing new. Weekly chart - we have week 6 of a setup. The completion of a setup will fit the plan perfect.

Subscribe to:
Posts (Atom)