Apr 24, 2021

Weekly preview

The market is topping. Either we are seeing the high with small double top or bigger version is possible if we see a decline next week.

Nothing much to add - in the time window for a high and the pattern looks close to completion, only short term divergences on some market breadth indicators are missing and they are being made with the topping pattern.


TRADING
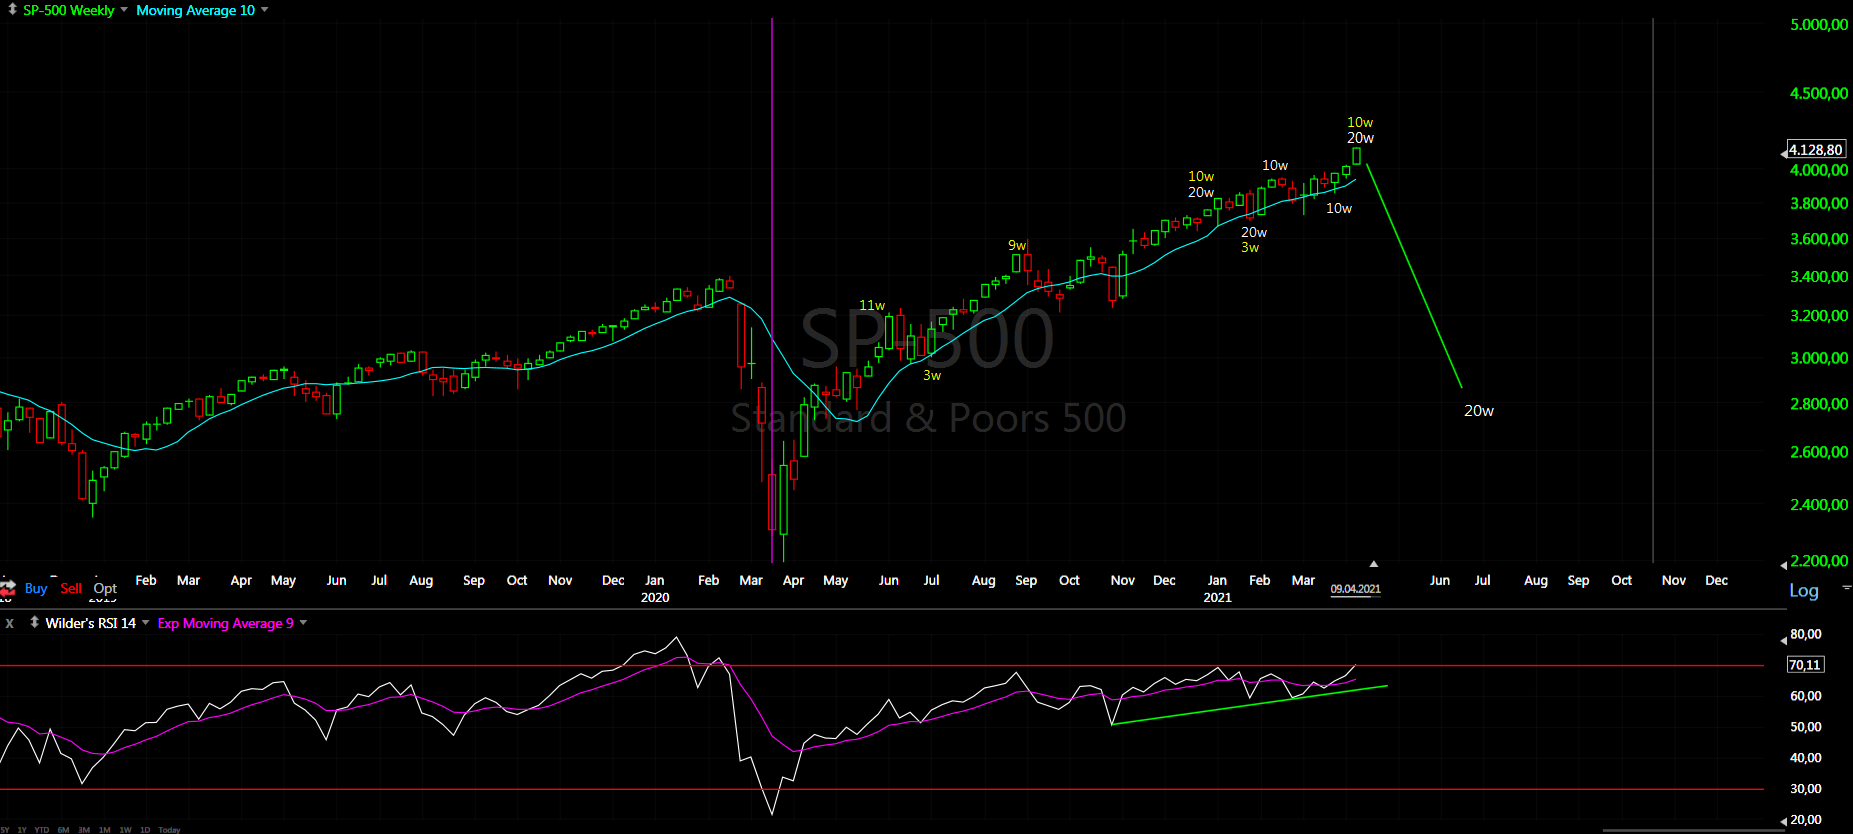
Trading cycle - buy signal, closes below and above MA10, RSI crossed the MA but still holding the trend line.
I have adjusted the lows and highs, this makes more sense.


TECHNICAL PICTURE and ELLIOTT WAVES
Short term - two versions of double top - the bullish outcome is to see a decline for a bigger corrective pattern a-b-c green. The bearish outcome is if we see a few more days higher this will complete double zig-zag c-wave of a bigger a-b-c red.


Intermediate term - I see one big zig-zag up. You can count it as W-X-Y(red) classic EW, but there is no impulses just more zig-zags. More likely series of zig-zags A-B-C(yellow).
Waiting for the market's final strokes to complete the picture.


Long term - the move from March 2020 is close to completion. After the top expect 8-10 weeks lower and we will watch how big the decline will be.
It is not much different than 2019 - two zig-zags with sideways correction in the middle for 40w low. The last acceleration phase is completed - the second leg of the second zig-zag. They even have the same shape and length 7 weeks just the red week alternates where it appears. Now only the topping phase is missing. In 2020 this was 20w low now this is most likely 10w low so I expect less than 4 weeks topping.


MARKET BREADTH INDICATORS
Market Breadth Indicators - turned lower some with divergences, other working on the missing short term divergences.
McClellan Oscillator - above zero with multiple divergences.
McClellan Summation Index - ready to turn lower.
Weekly Stochastic of the Summation Index - buy signal.
Bullish Percentage - turned lower.
Percent of Stocks above MA50 - turned lower and working on a divergence.
Fear Indicator VIX - trying to push higher and preparing for short term divergence.
Advance-Decline Issues - turned lower, in the middle of the range with divergences.


HURST CYCLES
Short term cycles - possible 20d low or if it is the bigger double top Tuesday-Wednesday next week. No perfect model to follow the high-low sequence.... the best I see at the moment is this shown on the chart. If it is the right one this is 10w low the next one making higher high for double top and reversing.
Next week we will know more when we see the price action.


Week 25 for the 40w cycle. Now the early March low looks better as 20w low. It is much easier to watch the 40w cycle - in 8-10 weeks it will be in the middle of the 32-36 week window for a low. This is all we need to know.
The 40w high is in the middle of this range already - this is week 34, waiting to see the double top how long it will take.


Tom Demark SEQUENTIAL AND COUNTDOWN - this technique spots areas of exhaustion.
One more week and higher high needed for completed TD sequential on the weekly chart.

Apr 17, 2021

Weekly preview

The market decided to move from zig-zag to double zig-zag the favorite pattern from the March.2020 low. This does not change the overall pattern or cycles just some stocks and indices mainly from the tech sector completing their patterns.

This is 18 month cycle high and the move from March.2020 is completing. How big the decline will be - we will see in the next two months.


TRADING
Trading cycle - still buy signal, but this will change soon. At day 42 is time for daily cycle high and the turn lower should be not just of 10w magnitude, but from 18m high into 18m low. The analysis said to ignore the previous crosses - not this time.


TECHNICAL PICTURE and ELLIOTT WAVES
Short term - from zig-zag to double zig-zag. DJ chart shows it more clear. g/C itself is complex wave another double zig-zag. Three different Fibo measurements point to 100-150 points(DJ not SP500) higher for perfect top of this wave.


Intermediate term - you can see this double zig-zags everywhere. You can count the whole move as big A-B-C consisting of two double zig-zags and inside them there is plenty of double zig-zags like g/A and g/C.
It does not matter what exactly it is, the important info is - it is corrective.


Long term - the move from March 2020 should be completed. Next week could start higher, but expect reversal. After the top expect 8-10 weeks lower and we will watch how big the decline will be.


MARKET BREADTH INDICATORS
Market Breadth Indicators - the same like last week.... the McClellan indicators are pointing to a top the others rather showing strength.
McClellan Oscillator - above zero with multiple divergences.
McClellan Summation Index - buy signal, weak with divergences.
Weekly Stochastic of the Summation Index - buy signal.
Bullish Percentage - very overbought.
Percent of Stocks above MA50 - extreme overbought.
Fear Indicator VIX - at the levels from last week.
Advance-Decline Issues - lower highs short and intermediate term.


HURST CYCLES
Short term cycles - we have 20d low probably on 07.04 the indicators I watch say 14.04 - the 5w cycle is dominant and the shorter cycles like 20d are not well visible.
The cycle highs on the other side look almost perfect 9+12 and 12+9 days for 5w and 10w cycle highs.
This is 10w high at week 33, which means 40w/18m high - I do not know how to twist it as something else.... you have to make a lot of assumptions which deviate a lot from the normal cycle behavior.


Week 11 for the 20w cycle. The 40w cycle high is 33 weeks long - the average range is 32-36 weeks.


Zoomed out the weekly chart - at the trend line with double RSI divergence.... good luck to all which see this as bullish.

Apr 10, 2021

Weekly preview

This week price and time targets has been met - from the March low we have two legs up with the same length 23 weeks and Fibo measurement 68% between them. According to my analysis this is the top for this move and 18 month cycle high.


TRADING
Trading cycle - buy signal. At day 37 the cycle is right in the middle of the time window for a 10w high.


TECHNICAL PICTURE and ELLIOTT WAVES
Short term - now we have two legs up with the same size and length 10-11 days.


Intermediate term - I see one big zig-zag up. You can count it as W-X-Y(white) classic EW, but we do not have impulses. More likely series of zig-zags A-B-C(yellow) with C as a diametric.
Interesting is the last three moves up have the same length 10-11 trading days.... lets see what follows lower - according to my analysis this is the top for the move from the March low.


Long term - the move from March 2020 is close to completion. After the high expect 8-9 weeks lower and we will watch how big the decline will be.


MARKET BREADTH INDICATORS
Market Breadth Indicators - are split the McClellan indicators are pointing to a top the others rather one more high because usually we have some sort of short term divergence.
McClellan Oscillator - above zero, multiple divergences.
McClellan Summation Index - buy signal, but very weak.
Weekly Stochastic of the Summation Index - buy signal.
Bullish Percentage - buy signal.
Percent of Stocks above MA50 - buy signal.
Fear Indicator VIX - made new low.
Advance-Decline Issues - nearing overbought level, lower high so far.


HURST CYCLES
Short term cycles - from the last high we have three weeks already so this is 5w high not just 20d.
DJ showing it more clearly - symmetrical 10w and 5w cycles completing 20w/18m high on Friday or Monday.
To extend the pattern you will need to shift the cycles to the right and add another 5w cycle high... this feels forced and does not look naturally.


Week 10 for the 20w cycle. With this week the two legs up have the same length 23 weeks. From the last 18m high the two 40w cycle highs are now equal 32 weeks long. This should be the next 18m cycle high.

Apr 3, 2021

Weekly preview

Higher as expected - another day or two are possible, maybe DJ needs to catch up with a new high, but overall the analysis I follow reached the end of the road. Waiting to see next week if it is confirmed or not.

If I have to guess what else could it be I would say one more 20d cycle high and ED for c/C/Y(see the daily chart)


TRADING
Trading cycle - buy signal. Entered the time window for 10w high. The next MA10 cross should mean we have 10w high and turn lower into the next 10w low.


TECHNICAL PICTURE and ELLIOTT WAVES
Short term - from the last low we have double zig-zag a-wave and simple zig-zag c-wave with c=0,618xa.
Lately double zig-zags are market's favorite pattern so it could decide to go for it and c=a in the next few trading days.


Intermediate term - I see one big zig-zag up. You can count it as W-X-Y(white) classic EW, but we do not have impulses. More likely series of zig-zags A-B-C(yellow).
MACD and and RSI with double divergences, waiting to see what happens next week.
With all this zig-zags is very difficult to make pattern analysis, one way to extend it another 2 weeks and still making some sense is this ED for c/C/Y.


Long term - the move from March 2020 is close to completion. After the high expect 8-10 weeks lower and we will watch how big the decline will be.
All indicators with divergences an RSI just hit the the cross point of the trend lines after a break and test of the rising trend line.


MARKET BREADTH INDICATORS
Market Breadth Indicators - the same only VIX plunged this week... hmm I do not know how to interpret this - VIX against all the others. The other indicators behave as it should be, even another volatility indicator I follow. Some one posted it somewhere I do not remember, but it is useful to find extremes and divergences - it behaves as it should at a top.
McClellan Oscillator - above zero with multiple divergence.
McClellan Summation Index - weak still sell signal.
Weekly Stochastic of the Summation Index - neutral.
Bullish Percentage - above 70, multiple divergence so far.
Percent of Stocks above MA50 - above 75, multiple divergence so far.
Fear Indicator VIX - made lower low, this is not the usual behavior at tops?!?!
Advance-Decline Issues - in the middle of the range, multiple divergence so far.


HURST CYCLES
Short term cycles - 11 days this should be 20d high and if my count is right 18 month high. If not expect one more 20d cycle high to complete the 18m cycle high.


Week 9 for the 20 week cycle. The 40w cycle high is now 31 weeks long and it is mature. The average length for the 40 week cycle lows is 32-36 weeks and the highs are running shorter so we are in the timing band for a high.