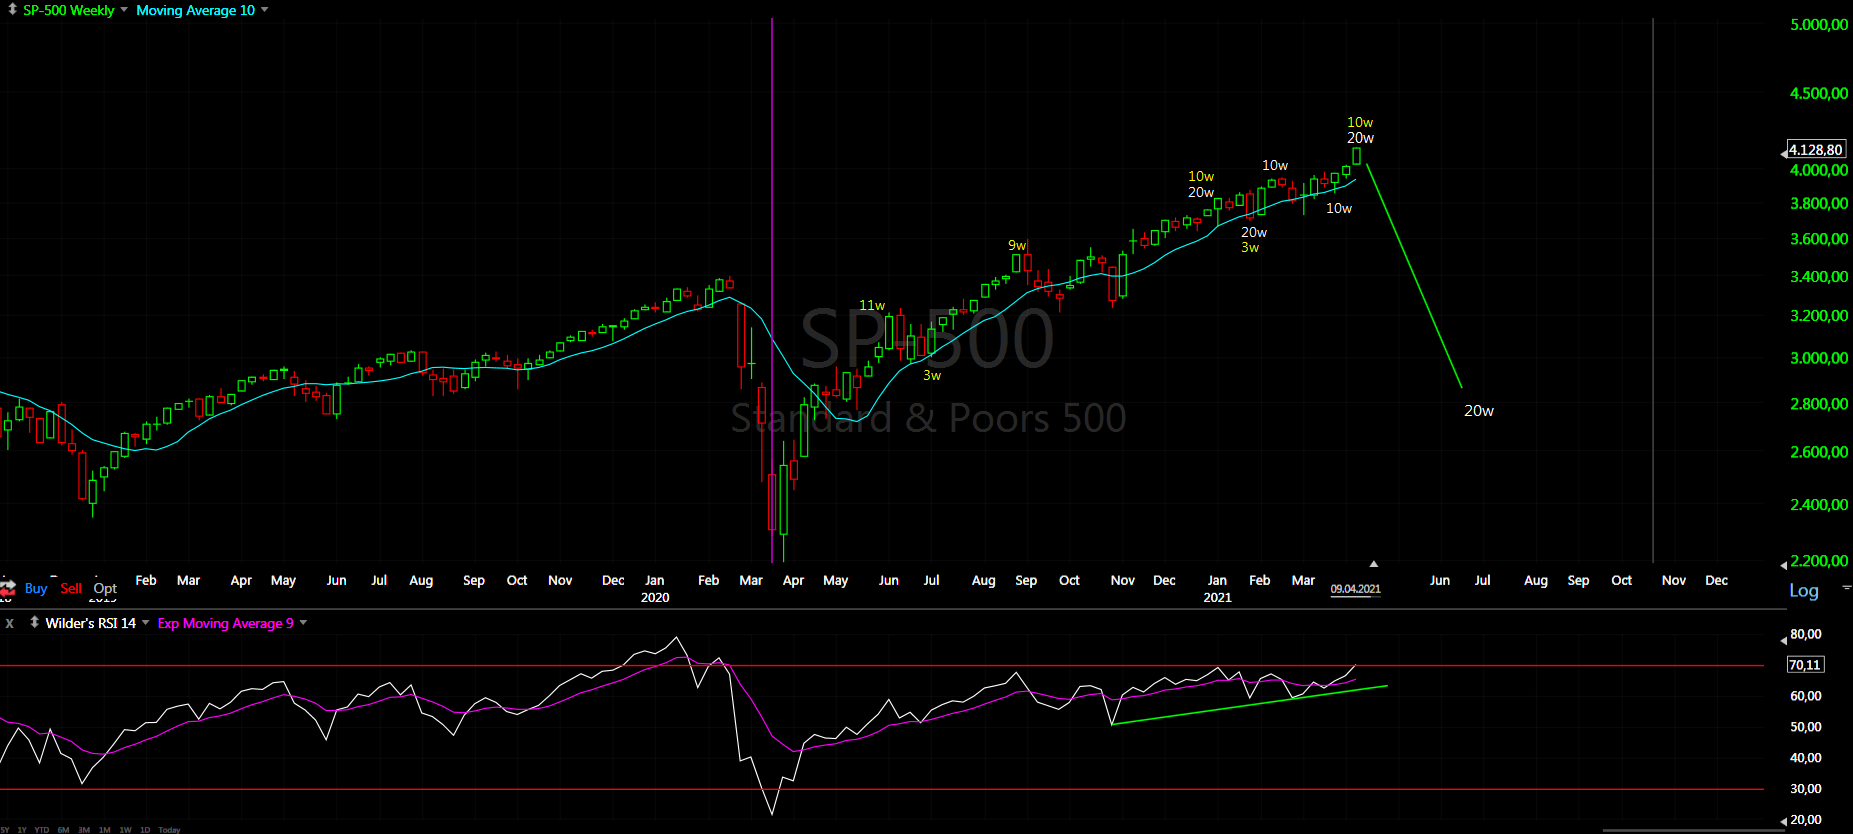
Trading cycle - buy signal. At day 37 the cycle is right in the middle of the time window for a 10w high.

TECHNICAL PICTURE and ELLIOTT WAVES
Short term - now we have two legs up with the same size and length 10-11 days.

Intermediate term - I see one big zig-zag up. You can count it as W-X-Y(white) classic EW, but we do not have impulses. More likely series of zig-zags A-B-C(yellow) with C as a diametric. Interesting is the last three moves up have the same length 10-11 trading days.... lets see what follows lower - according to my analysis this is the top for the move from the March low.

Long term - the move from March 2020 is close to completion. After the high expect 8-9 weeks lower and we will watch how big the decline will be.

MARKET BREADTH INDICATORS
Market Breadth Indicators - are split the McClellan indicators are pointing to a top the others rather one more high because usually we have some sort of short term divergence.
McClellan Oscillator - above zero, multiple divergences.
McClellan Summation Index - buy signal, but very weak.
Weekly Stochastic of the Summation Index - buy signal.
Bullish Percentage - buy signal.
Percent of Stocks above MA50 - buy signal.
Fear Indicator VIX - made new low.
Advance-Decline Issues - nearing overbought level, lower high so far.
HURST CYCLES
Short term cycles - from the last high we have three weeks already so this is 5w high not just 20d.
DJ showing it more clearly - symmetrical 10w and 5w cycles completing 20w/18m high on Friday or Monday.
To extend the pattern you will need to shift the cycles to the right and add another 5w cycle high... this feels forced and does not look naturally.

Week 10 for the 20w cycle. With this week the two legs up have the same length 23 weeks. From the last 18m high the two 40w cycle highs are now equal 32 weeks long. This should be the next 18m cycle high.
i commend you for stating your view point. it takes uncommon bravery. looking at stochastic weekly, i personally think there is substantial upside, esp considering sentiment. 4175 to 4300. it is interesting how others are seeing a 3rd of a 3rd of a 3rd. hold your ground krasi.
ReplyDeleteNothing to do with bravery - it is all about pattern and time and I do not care what the others think.
DeleteThe other "experts" with 3rd of a 3rd of a 3rd are seeing it for the third time and for the third time will be wrong - normal when some one can not make difference between impulse and zig-zag
4175 is only 50 points away.
ReplyDeletei would be looking for a minor pull back of less than 5% at any rate before higher. this goes until the fed tapers.
DeleteWhat is so special about 4175?
Deletehttps://twitter.com/StockReversals dave bannister is almost always right. i have followed for 12 years. he is good.
DeleteThank you, Krasi. I think top building can take some time (weeks), with some sideways move and an overthrow at the diagonal. So we shall be ready to have topping till about end of April, no rush into short positions yet imo. Continuous VXc futures shall come down further to 16.9 to close pre-covid gap, which will be important piece of a puzzle for this intermediate top in equities.
ReplyDeleteMcClellan, who rarely writes anything bearish, noted that the "leading indication message from crude has called for a stock market top due in April 2021". There could be a lag of 6 months. Also the M2/GDP peak is June, so he expects a top this summer.
ReplyDeleteEarlier, in the last years crude move in lock step with the indices or a few weeks earlier - crude already reversed and waiting for the indices.
DeleteI don't think the drop will be that great. Most likely 3300 max. David Hickson is saying the trough is a 18 month magnitude trough. The one in March of last year was a 9 year trough.
ReplyDeleteEW count says this will be wave 2. Market is setting up to go alot higher after this drop.
All your assumptions are wrong.
DeleteDavid Hickson is saying the trough is 18 month magnitude. How is that wrong? He stated multiple times in his videos. It only makes sense that this next drop will not be like the one in March last year.
DeleteCycle guys have no clue about patterns... Examples:
Delete- 2019 so strong 18 month cycle small correction and much higher - what happened? the same is repeating
- 2020 must be important high - commented below Hickson's video there is no important high/low in the middle of a pattern only at completed pattern. One year later the high has been exceeded.
Short said all they can tell you strong right translated cycle is bullish small correction and much higher - this is all they know, which usually works, but it is wrong this time.
And no the pattern is not an impulse and there is no wave 2.
https://www.youtube.com/watch?v=-Pc_98IqTEo&ab_channel=SentientTraderVideo
ReplyDeletenew vid from hickson
he expects a peak in the middle of may. its april last i checked...
DeleteWatch carefully
Delete- before mid-May, April is before that last I checked.
- the zig-zag measurements are showing clear that time and price targets has been reached.
:^) yes, if weaker before the 19th of may
DeleteHi Krasi, how likely to you is that we made the top. what is the alternative if we continue to grind higher another month or more? thanks.
ReplyDeleteI do not have such alternative.
DeleteNot to be rude but is there anyone in here who has applied EW over the years and made any serious money or is this all just an exercise in theory?
ReplyDeletewould imagine it must be the latter since these guys have been in the wrong side of the market since forever.
DeleteThose who can make proper EW analysis and know how to make it part of trading system - yes.
DeleteOthers who can not use it, like the guy above - obviously not.
If EW is so correct then why didn't you just say we will be over 4K a year ago? Look back at your charts a year ago. Right here: http://practicaltechnicalanalysis.blogspot.com/2020/04/weekly-preview_25.html
DeleteWhat does everyone see on the short term, intermediate and long term chart? Read the wording closely. After you have read his post from April 2020 now read this,"Those who can make proper EW analysis and know how to make it part of trading system - yes.
Others who can not use it, like the guy above - obviously not." Do we all get it now?
Because it does not work this way EW is not a crystal ball. You can not predict corrective pattern in advance.
DeleteWhen I saw it developing I can tell you it is correction and it will be retraced.
When you see more than half of it you can give some targets like 4100 mentioned weeks ago in comments.
Hi Krasi...any books that you recommend to understand cycle analysis please...apart from the ones you listed on your site....I a unable to understand your analysis completely ..hence the ask..Thanks in advance
ReplyDelete*am unable
DeleteThere is other books and courses from Hurst, but they are much more complicated.
DeleteI use just the basics no complicated theory what so ever.
I will try to explain it..... the theory is simple - there is cycles, which the indices are following and they are:
20 days/40 days(5 weeks)/80 days(10 weeks)/20 weeks/40 weeks/18 months/54 months(4,5 years)/9 years
This is called Hurst nominal model and this are calendar days not trading days.
In trading days the shorter cycles - 14 days/28 days/56 days, for the longer one it does not matter any more.
Every asset has it's own rhythm - slightly shorter/longer or close to the nominal model(the theory).
The US indices are running with shorter cycles than the nominal model like this:
10-12 days/4 weeks/7-9 weeks/14-18 weeks/32-36 weeks/16-17 months/4 years/7.5-8.5 years
There could be outliers, but 90% off the time are this ranges.
To sum up the whole theory I use is:
Theory - 20 days/40 days(5 weeks)/80 days(10 weeks)/20 weeks/40 weeks/18 months/54 months(4,5 years)/9 years
Praxis - 10-12 days/4 weeks/7-9 weeks/14-18 weeks/32-36 weeks/16-17 months/4 years/7.5-8.5 years
The rest is experience... the problem is one of the main cycle characteristic is - they vary. This is what frustrates many and they give up claiming cycles do not work.
Ask? What exactly is not clear?
What do you think of Ask Slim's forecast. He sees a shallow drop in May followed by one final rally before we have a final top in and around June.
ReplyDeletehttps://www.youtube.com/watch?v=zmtN9DtfYoA&ab_channel=SteveMiller
According to Hurst cycles this is nonsense. Linear extrapolation without much thinking.
DeleteThis are 20w cycles only 5 weeks so it must continue another 10 weeks. It is strong right translated cycles so it must continue(extrapolation without much thinking) - it works in trending markets. This is not trending market this is crazy sideways correction.
Krasi, what do you think of the cycles count of David? 2009 and 2020 9 years low with 3 cycles of 4 years, 2012, 2016, 2020
ReplyDeleteNot an important pattern low so not a 9 year cycle low.
DeleteNo impulse down yet! Hmmm!
ReplyDeleteKrasi, look at the monthly chart, we hav a nice ABC in 4400
ReplyDeleteLady S you are the most annoying person on this blog!! you are unbearable. Sorry Krasi I had to say it after trying to control myself very many months now.
DeleteJP
I understand you very well:)))
DeleteLady S my ABC is nicer:)
Lady S has been right on the money. I look forward to her comments.
DeleteATH again, back to the drawing board, Krasi. This thing is going to zig zag up another 100 points!
ReplyDeletePathetic.....
DeleteWhy? Is it not going up, no?
Delete50 points higher than your A=C, this is the top be careful, target from last week.
DeleteHe's hardly pathetic.
Still on schedule for a high this week . NQ leading again today and there is resistance around 13990-14040 , which may give an entry .
ReplyDeleteDidn't get the pullback I wanted before this weeks high and still nervous about expiry on Friday . Unless we close lower today , I see us higher still into an expiry blow-off.
So being careful about shorts beyond a position today should NQ hit that zone ....until we have better signs of reversal.
The course of a decade long policy based on monthly inflation data, market at highs, and another covid wave happening in stealth .. I mean what could go wrong?
ReplyDeletewhat do you mean with covid in stealth?
DeleteI bet on something what we do not know.... covid is old news.
DeleteEverything could go wrong. So many levered up skeletons in the closet. The level of fraud is unprecedented, just a small selling, i.e. profit taking can turn into forced "margin call" selling. Stability breads instability
DeleteAs usual "no one see it coming" and there will be an "narrative" or "reason" but the matter of fact is everyone is on the same side of the boat x 10 via leverage (because the fed has our back etc) and you only need a small snowflake when the critical mass is achieved to trigger the avalanche :)
DeleteWe have max liquidity with max leverage. What could go wrong?
DeleteThe zenscondlife guy has been writing about this.
"stealth" refers to this new wave in some emerging markets that is causing a round of lockdown, no one is talking about it.
DeleteWhen i said what could go wrong, that was sarcastic .. markets are pricing in perfection imho.
https://zensecondlife.blogspot.com/2021/03/financial-weapon-of-millennial.html
ReplyDeleteSorry link should be to margin debt levels only
Deletehttps://1.bp.blogspot.com/-EigRUoPu550/YFTR1MRjnOI/AAAAAAACEOk/R1933pWxozoluj-UP_2ocZRXkGbTqgAEQCLcBGAsYHQ/s1000/margin_debt.png
Even-though this guy always calls for a crash I like his rants as very logical
Deletepretty clear nq will reach 14000. sure looks like 14,400 will be resistance. there is no fear present so this will need an exogenous event that is unseen.
ReplyDeleteLook at all the major tops over the past 22 years. 2007, 2020. There is a pullback then one last rally for a double top or new high. We have been making new highs for 4 straight weeks, we need more divergence. I see no top until June, right now I am expecting a pullback to 3600-3700 area.
ReplyDeleteI do not know how many times to repeat it this June top is fantasy - cycles says so.
DeleteYou want divergence look the NDX double top on the daily with quadruple RSI divergence on the weekly chart.
Krasi, this is another indicator - the more visitors you have "forecasting" 3600-3700 in SP500, the closer it is to intermediate top. The more vertical move is, the more vertical the drop. They way market making works does not change. Yes, we are in final intermediate wave higher and one can/shall take advantage (with intraday trades in my opinion), what is the reason to go short prematurely until price action shows it? In my work I have April 15/16th as next local turn (cit) date.
DeleteDXY is falling. Interest rates are falling. Don't disagree with your analysis but isn't this bullish for stocks?
ReplyDeleteNq showing little reaction to the 14000 area . Waiting to see if we get a pullback in rth today , but if not the risk of a blow -off into expiry on Friday increases.
ReplyDeleteExpiry tops are nasty things if you're the wrong side of one . Next resistance in NQ would be 14400-500 , ES around 4180/90.
It's not over til it's over .
14050, canal top
ReplyDeleteS&P 4200, canal top
ReplyDeleteother count: october 40w high, february 20w high, march 20w low and now this in only 10w high
ReplyDeleteThe high/low is not in the middle of corrections.
DeleteOnly 25 points to the magic 4175 level.
ReplyDeleteLook at apple, clear as day 5 waves down and an abc up. Big 3 incoming.
ReplyDeleteYesterday AAPL,TSLA and the tech sector completed their pattern and pulled the SPX a littel bit higher.
DeleteToday the rest of the market DJ,NYSE,XLF are heading higher to complete their pattern double zig-zag for c/C and holing it above water.
The air is getting thinner and thinner.....
05-04 20d high and 07-04 20d low?
ReplyDeleteIt look like so, but it is really difficult to say.
DeleteThis is not so important we have at least 10w high which means with very high probability this is the 18m high
I hope so Krasi , but there's a chance they all want a crescendo day too on Friday into the expiry close , which typically has few sellers on an up close and a spike after hours . Could be a retest of the high in NQ and 30 pts higher in SPX with Dow at 34100 .
ReplyDeleteBut yes , almost there ...
It looks too weak to me.... we could see a drop and up day on Friday close to the strike price they want.
Deletearound 1,11-1,13 in eur/usd for summner?
ReplyDeleteI do not know, no idea about the pattern. One guess triangle in this case this range looks good.
DeleteMost by now can see the huge megaphone resistance at 4165-70. I would imagine a pullback from there then breakout. Yea, Yea, I know. I'm an idiot.
ReplyDeleteI have no other explanation when you fall for the same bullshit twice.
DeleteThis pullback will last 2-3 months. The pattern is completed there will be no break out and continuation.
Curious what will continue with this break out?
If we get the breakout 4500+ on higher time frames.
DeleteCloser to 4500 than 2200. Just sayin'
Deletethink of all the large traders buying $COIN today on leverage. Appropriate
ReplyDeleteNot far off the 4175 level, big level for the bulls!
ReplyDeleteAnd what is so important about this level?
DeleteIt does not matter if it will be reached, exceed or not. This is the top - cycles say so.
There is no magic levels, which can change pattern or time - no matter which guru says so.
Sure all levels are subjective to the person deciding their importance, be it an a=c or a top of trend line, a megaphone etc. It's all astrological bs.
ReplyDeleteKrasi, when we have the top cycles?
ReplyDeleteCycles must be in sync with the move to 4175. Make or break at this level according to my sources! Be careful here, people! Anything could happen
ReplyDeleteThere's the crescendo to new highs in INDU,SPX & NQ. Scale in the first bit here & add on a HH or break back below tomorrow....
ReplyDeletekrasi-really great comment section this week. congrats.
ReplyDeleteThere is still a lot of greed left in this rally. You would be some fool to think this is going to collapse imminently! I'll gladly eat my hat if I'm wrong!
ReplyDeleteRussia coming with the big FU to Biden.
ReplyDeleteMarch 2020 was a major top! This is possibly a SuperCycle Wave 3 top or less likely Cycle Wave 3 top. Either way, we are going to crash hard soon.
ReplyDelete4175 hit, momentous!!
ReplyDeleteShit, it broke through 4175. What happens next, Krasi?
Delete4176?
DeleteNext is top and reversal 9+12 and 12+9 days for 10w high - https://invst.ly/uhrqr
DeleteMy first short 1/3 - time looks right, pattern looks complete and multiple RSI divergence on the 4h chart.
And there is the pattern another double zig-zag near completion better visible on DJI - https://ibb.co/qx58rWV
DeleteWhy would you short in April? Why not wait until closer to 4280 or when a support breaks? We all know May and June will be choppy and down. Been that way for 20 years. Sell in May go away. No theory needed.
DeleteI don't see the risk/reward trying to call a top. Anyway, doesn't matter. I'm moving along. Good luck.
Delete4200 sometime today
ReplyDelete