Jun 29, 2011

Short term update

Great call:) perfect hit of the target and retreat.
Lets see if a sell off will begin or consolidation before the next move up. There is higher target ~12380-12400 on Dj and ~1315-1320 for SP500.

The same story with SP500 40 points rise from the second low:)
For now the prediction works perfect but we must cautious and not get too excited. The market is full of surprises:)

Here is the alternation.... the odds are still high for this scenario...

Jun 25, 2011

Weekly review / Седмичен преглед

Last week I was expecting a rise to ~1295 SP500 followed by a pullback. But the "pullback" was too deep to be a pullback something else is going on. I think the indexes will move sideways for a while and then the selling will resume. Initial target is ~1220 SP500 but it could easily go lower to ~1175(the next support level). Alternate scenario is selling climax next week.
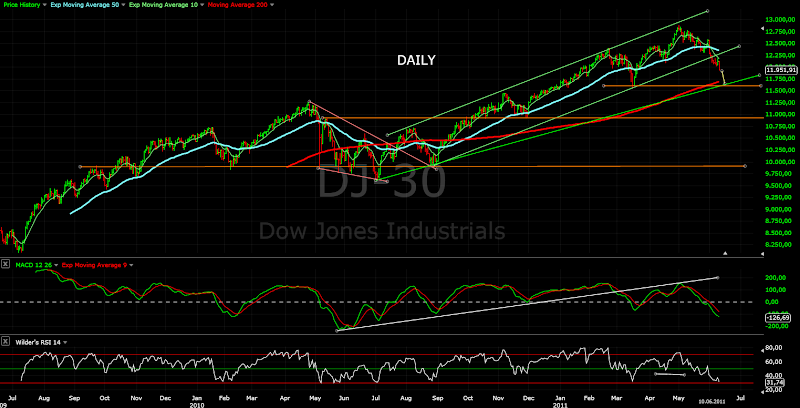
Scenario moving sideways or slightly higher and resuming of the sell off. DJ support level ~11600 - 38,2% correction of the rally since July 2010.Alternate scenario selling climax.Closer view of the two options shown on the hourly chart of SP500.

Jun 18, 2011

Weekly review / Седмичен преглед

I have shown 15min chart on Wednesday, the squiggles have played pretty well. Friday SP500 gapped up but there was no follow trough. Short term is difficult to say how exactly the next 1-2 days will look like. The two option are shown on the chart bellow. Lets see the open on Monday.

Intermediate term view has changed a little bit. I think we will see a relief rally which will ease the oversold conditions followed by a sell off(green option). Alternate scenario is that we will see soon a bottom and a rally to a marginal new highs(red option). Yellow option - selling climax and a bottom.

Why exactly bounce followed by a sell off?
Bounce - technical indicators (see the daily and hourly chart bellow), sentiment too bearish, Put to Call ratio, SP500 percentage of stocks above MA50, NYSE McClellan Summation index. All short term indications showing oversold conditions.
Sell off after that - trend following indicators and weekly chart showing no signs of bottoming. See this article too, is interesting showing swing trading using VIX/VXO.

The option with the highest probability is shown on DJ daily chart. MACD divergence on the 60min chat (see bellow) and histogram moving higher. I expect a bounce to start next week. Target ~12350 - 50% retracement of the sell off,the broken trend line, the falling trend line and MA50 - pretty gut cluster of resistance. Final destination of the sell off at least 38,2% retracement of the hole move since July 2010 and the next trend line.
Closer view 60 min chart with the alternate scenario.

Option players are very emotional and getting in panic mode like in 2008... after 7% correction:)

Jun 15, 2011

Short term update

Last week I have shown this hourly chart with MACD divergence expecting another 30 points reaction with bearish and bullish scenario after that. Well the reaction was 27 points from 1265 to 1292. SP500 could not reach resistance around 1295 and obviously the bearish scenario is playing out now.
Closer view 15min chart...

Jun 11, 2011

Weekly review / Седмичен преглед

I have thought that we will see some kind of bounce this week... it does not played out this way. After four trading sessions the indexes were flat and then on Friday.... strong sell off. The picture is bearish no doubt. The DJIA and SP500 have broken the trend lines and the next support level is shown on first two charts bellow - the trend line from the March 2009 bottom MA200 on daily chart and EMA50 on the weekly chart.
The Problem which I have with this scenario is that everybody is focused on this level and the berish sentiment is very high. The market never rewards everybody... never.


The intermediate term view has not changed a lot. I think we will see soon a bottom followed by a rally, but do not get prematurely bullish we have not reversal signal yet.
I see two equally probable options - first a rally to marginal new highs and the second test of the broken trend line and the last minor highs around ~1340 and then another sell off (for both scenarios) to much lower levels.
The short term - I have no idea how the indexes will form a bottom. They can start a rally on Monday - we have a triple divergence on the hourly chart (see bellow). Selling climax and another big red candle hitting the support level. Pushing down and strong reversal printing hammer candle at support level... I do not know lets wait and see, but I think we are near to a bottom and getting too bearish now is riskier.
This triple MACD divergence on the hourly chart makes me cautious getting too excited on the short side. My best guess - move to the resistance level around 1300 (another 30 points reaction).
DAX finds very very strong support between 7000 and 7050 for the last three weeks. The oscillators are showing triple divergence now. The probability is very high that we will see at least two to three week rally and prices testing at least the last minor highs between 7350 and 7450.

In a bull market this levels usually mean a bottom. Currently at 16,20. We are still in a cyclical bull market. 7% correction is not a trend reversal. We have had several correction of this magnitude for the last two years.

The sentiment is very bearish look at the put to call ratio. Such levels we have seen last time in 2009 March and July. What have we? Six weeks correction and 100 points on the SP500 around 7%. I do not think that this is very dramatic, but the sentiment is again the world will crash and burn....

Jun 9, 2011

Short term update

I was expecting some kind of a bounce this week, but the bulls are much weaker then I thought. I have shown this new trend channel last week. The sell off continued another three days and we are now at the lower boundary of the channel. If we should see a rally the bulls must show.... NOW:)
Next support is the March low and MA200. If you go through the blogs in Internet everybody is focused on this levels. I do not like this. It never plays out the way which everybody is expecting. That means the bullish scenario will play out from this levels now, or we will see a bearish scenario lasting longer and heading much lower.

In a bull market (and we are at least in a cyclical bull market) the percentage of stocks above the MA50 for SP500 after a correction usually bottoms around 25%. Interesting chart telling the same story - we are near to a bottom.

Jun 4, 2011

Weekly review / Седмичен преглед

Ok, the sell off this week makes the bearish scenario equally probable as the bullish scenario - both shown on the first chart bellow.
In both cases I expect a rally for several days next week, reaching the upper trend line of the channel(see the hourly charts bellow SP500 and DJ). Interesting is what will happen after that. Will the bulls manage to break the channel and close above the last minor highs or not? Frankly no one knows. So I will keep an eye on both options.

->Bullish scenario(green) - a rally to marginal new highs 1380-1400 on SP500. The Index will hit the upper channel line of the wedge or a new trend channel with different slope(see the charts for the bullish scenario). The months June,July,August are not months where major moves happen. So I do not expect the next rally lasting several months with gains 20%+, but marginal new highs is in the cards.

->Bearish scenario(red) - the trend line is broken and we are in a correction of a bigger degree. SP500 will test the broken trend line challenging the last highs around 1340. The test will fail and we will see a sell off with first stop at the next support level around 1240.

P.S. I do not use Elliot wave to trade, but I have found an Interesting blog with Elliot wave count summing up my both options.Notice the post is from 25-th of May, but the Indexes follow it accurate like a clock:)


BULLISH SCENARIO
Next week expect a rally for 2-3 days followed by a higher low. The bulls will hold the support level at 1295. Then we will see the wedge playing out. There is another option - lower low with divergence, SP500 bottoming around 1285 and forming a new channel with different slope.
SP500 holding support and forming a wedge.
SP500 breaking bellow the last minor low but reversing quickly forming a trend channel with different slope.
One reason why I am expecting a rally for 2-3 days. DAX bullish candle and the oscillators are showing divergence.
See the chart above SP500 histogram - the same story but the bullish candle is missing. We need a solid up day on Monday.


BEARISH SCENARIO
The indicators are bearish - the histogram on the weekly chart is pointing down, the MACD on the daily chart is bellow zero pointing down, the price is bellow EMA50, the trend line is broken. The next support level is the next stop - ~1240 for SP500 and ~11600 for the Dow.

Weekly chart support level ~11600 which was important level several times in the last years, EMA50 support, trend line support from 2009 bottom.
Daily chart - trend line is broken next support level the last important low, support MA200, support the trend line.
Hourly chart - rally to resistance followed by a sell off to support level.

Jun 1, 2011

Short term update

He-he-he sometimes the market makes you look like complete idiot:).... Now... clueless... lets wait and see...

Maybe H&S