Intermediate term view - the pullback should continue another week or two.
This past week the alternate scenario for the short term has played out. This is the surprise if this could be a surprise. The bigger picture has not changed - we are in the middle of the pullback.
There is no much to say this week. The correction is still not over we have another week or two. I am watching the 23,6% and the 38,2% Fibonacci retracement levels.
TECHNICAL PICTURE
Short term - a lot of possibilities... the opening on Monday will give us more information. I think the index will either move down from this levels or will try to touch the trend line around 1455 and move lower. The first drop was 44 points another one with the same size will push the SP500 into the support zone. In this area there is support from the trend line since the June low too.


MARKET BREADTH INDICATORS
The most indicators issued a sell signal.
McClellan Oscillator - below zero confirming the move.
McClellan Summation Index - issued sell signal.
Weekly Stochastic of the Summation Index - still in buy mode but it has inertia, this is a weekly indicator.
Bullish Percentage - issued sell signal.
Percent of Stocks above MA50 - moved below 75 confirming the move lower.
Fear Indicator VXO - has started to move higher. probably we will see it around 20 before the pullback is over.
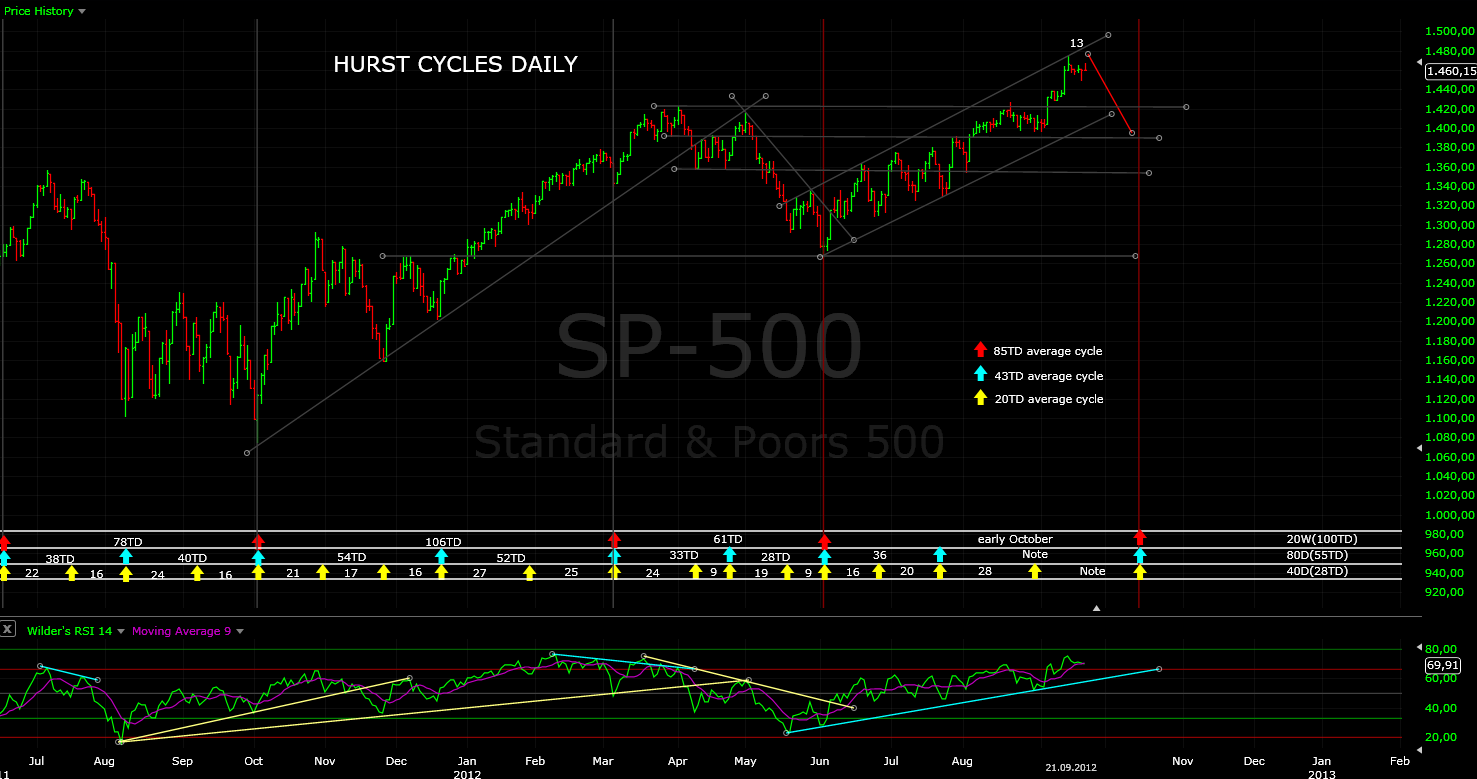
CYCLES (TD - trading days)
Currently at day 18 from 20 day nominal Hurst cycle. It is moving right on track.
I expect the pullback to finish this 20 day cycle and the 20 week cycle. Another strong move up will mark the beginning of the next 20 week cycle.

Tom Demark SEQUENTIAL AND COUNTDOWN - this technique spots areas of exhaustion.
Nothing has changed since last week. You can see the chart from the last week post.