Intermediate term view - I think we will see a short term top soon and 4%-5% pullback.
Another week without surprises - as expected SP500 moved lower to the EMA50 on the hourly chart and bounced.
Short term I expect the indexes to hold this levels and try to test the highs. Its the end of the quarter and the funds must show good results so I do not expect troubles next week.
Intermediate term I still think that we will see a 4%-5% pullback. The long side is just too crowded. The banks will flood with money and save the world, there is only one direction - up, the VXO is at 12 the most bullish readings since 2009..... If you step back and look at the charts since August the SP500 is moving sideways and there is only two big green bars the ECB and FED meetings after that no follow trough at all. The big players new that QE is coming and have started buying in June and the news, the big bars are the end of this move and not the beginning. Look at the move from the lows October last year and the June lows - moving higher and higher for 2-3 weeks. This was a beginning of a new move from a depressed levels and follow trough and now is just an exhaustion.
So I think the next move is healthy pullback to shake out the crowd before moving higher.
TECHNICAL PICTURE
Short term - I think we will see another bounce of EMA50 and retest of the highs. If SP500 breaks bellow the last low at 1450 that would mean the pullback has already began. With the end of the quarter next week the first scenario has much higher probability.


MARKET BREADTH INDICATORS
The market breadth indicators are bullish, there is no divergence on the VXO anymore. Anyway I think this is a top but short term only to reset the indicators and the bullish sentiment. I do not see signs of a major top but healthy pullback is in the cards.
McClellan Oscillator - flirting with the zero line. A new high on the SP500 will lead to a divergence on the indicator.
McClellan Summation Index - no change this week, still a buy signal.
Weekly Stochastic of the Summation Index - no change this week, still a buy signal.
Bullish Percentage - no change this week, still a buy signal.
Percent of Stocks above MA50 - retreating but still no bearish signs.
Fear Indicator VXO - the most bullish readings since 2009. Every time when the VXO reached this levels we saw a top. I do not think that this time will be different.
Put to Call Ratio - near to overbought levels
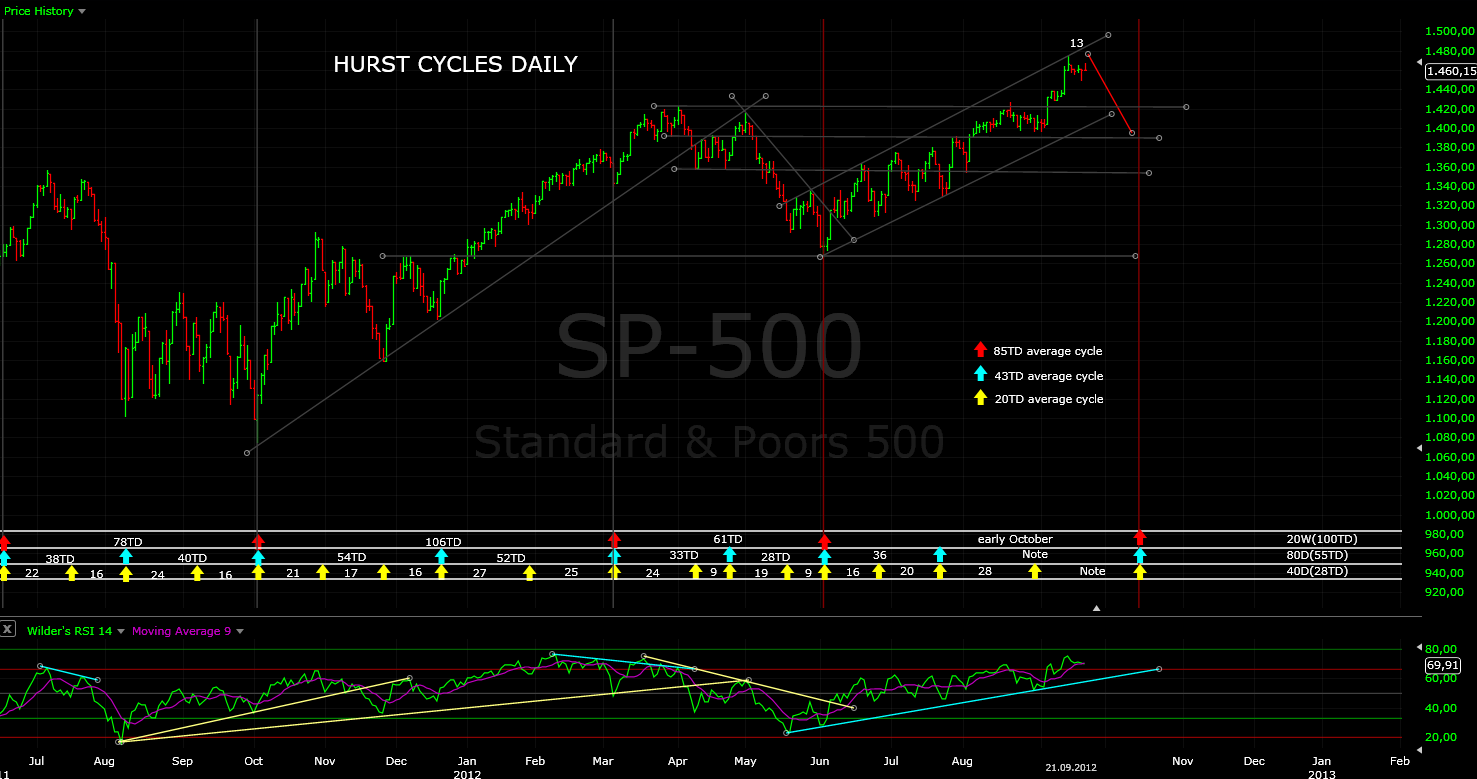
CYCLES (TD - trading days)
Currently at 13 from a 20 day cycle. I expect the pullback to finish this 20 day cycle and the 20 week cycle. Another strong move up will mark the beginning of the next 20 week cycle.
Tom Demark SEQUENTIAL AND COUNTDOWN - this technique spots areas of exhaustion.
On the daily chart nothing has changed SP500 is at 11 from a combo(see the chart from the last week).
On the weekly chart we have 6 from a countdown and 9 from a combo. I think after the pullback completed combo or countdown will mark the end for this wave which started in June.

No comments:
Post a Comment