Mar 30, 2024

Weekly preview

Slow price action.... holidays, close to the top the pattern and the cycles look more clear. Still waiting for the small final wave, it takes longer because we have another zig-zag - the supposed implulse c-wave consists of sub-waves which are zig-zags.

Overall nothing new just the sentiment is getting more extreme, agressive and absurd.... so much bullshit it's unbelievable and all this for the fourth time in row every two years since 2017... literaly the same. It happens at every important top... for those who think they are very smart and special and this time is something different - well not really the same dumb and greedy "traders". And here commes history and statistics:
- final wave blow off 5 months in 2017 followed by 20% correction in 2018.
- final wave blow off 5 months in 2019 followed by 35% crash in 2020.
- rounding top in 2021 followed by 27% correction in 2022.
- final wave blow off 5 months..... wait this time is different.

P.S. until 2019 I was polite answering to every comment and explaining... until it escalated to realy crazy levels. After that I do not care. At every top is full with greedy dumb xxxx and their comments are just deleted. If you do not have analysis to share or ask something it will be deleted. If you do not like my analysis do not read it, this is not an "emotional trashbin".


TRADING
Trading trigger - buy signal.
Analysis - at important top every two years early 2018-2020-2022-2024 etc.
P.S. - for a trade both analysis and trigger should point in the same direction.


TECHNICAL PICTURE and ELLIOTT WAVES
Short term - the same very choppy c-wave impulse or ugly y-wave completing y=w/Y. The final wave is another zig-zag we saw the b-wave this week and next week expect the top.


Intermediate term - counting this as an impulse for a-b-c... it does not matter it is a top - pattern,cycles and indicators are clear.


Long term - 4y cycle high the end of 2021, now a-b-c lower into 4y cycle low. Alternate this is the top of wave-B from 2009.


MARKET BREADTH INDICATORS
Market Breadth Indicators - no change weak with divergencies.
McClellan Oscillator - above zero with divergences.
McClellan Summation Index - buy signal with divergence.
Weekly Stochastic of the Summation Index - buy signal with divergence.
Bullish Percentage - above 70 with divergence.
Percent of Stocks above MA50 - above 75 with divergence.
Advance-Decline Issues - multiple divergences.
Fear Indicator VIX - higher low, divergence.


HURST CYCLES
Short term cycles - around the end of next week we should see completed 20d/5w/10/20w/40w cycle high.


Week 22 for the 40w cycle. Probably 20w low at week 20 in March, I expect 40w cycle vusialy consisting of three extended 10w cycles.
Week 35 high-to-high, at the top of at least 40w cycle... most likely 18m cycle high.
Average length for the 40w cycle is 32-36 weeks the last 40w low was 33 weeks long and now the high is 34 weeks long maybe the market is back to normal rhythm after shorter cycles from mid-2022 to mid-2023. In this case next important low is in June and next important high in November.

Mar 24, 2024

Weekly preview

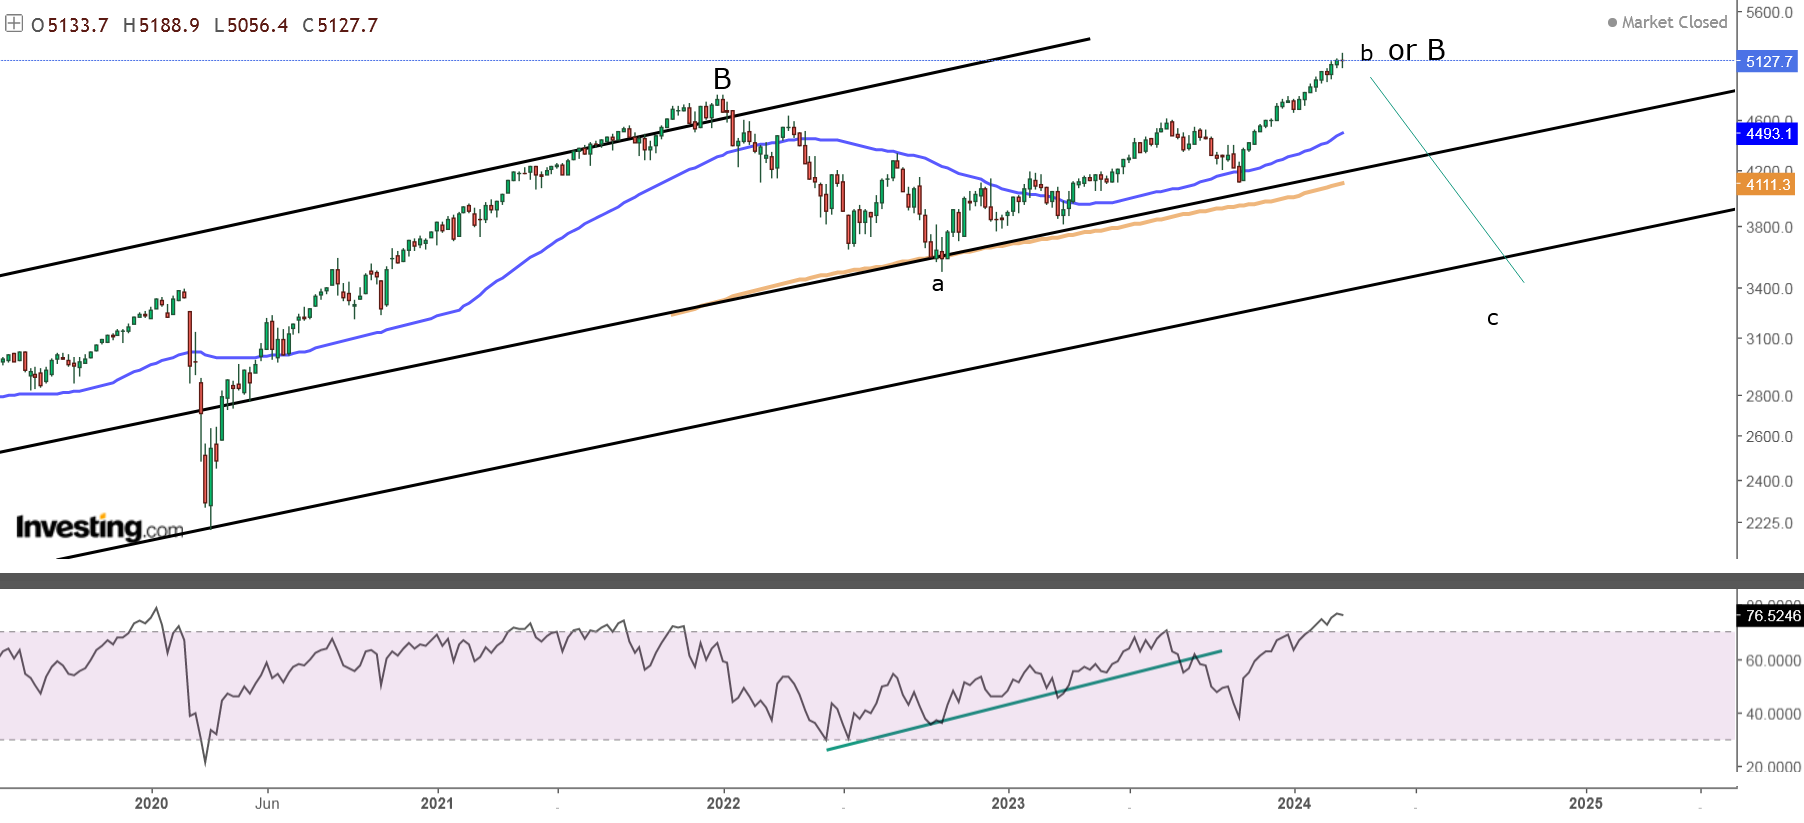
Final hooray higher now we have possible three legs higher for ugly impulse c-wave of a-b-c. The big picture does not change this is important top.


TRADING
Trading trigger - buy signal, very extended cycles 60+ days(high-tohigh) most likely two daily(10w) cycles.
Analysis - at important top every two years early 2018-2020-2022-2024 etc.
P.S. - for a trade both analysis and trigger should point in the same direction.


TECHNICAL PICTURE and ELLIOTT WAVES
Short term - the choise is very choppy c-wave impulse or ugly y-wave completing y=w/Y. One more wave v/5/c will look better for completed pattern.


Intermediate term - counting this as an impulse for a-b-c... it does not matter it is a top - pattern,cycles and indicators are clear.


Long term - 4y cycle high the end of 2021, now a-b-c lower into 4y cycle low. Alternate this is the top of wave-B from 2009.


MARKET BREADTH INDICATORS
Market Breadth Indicators - no change weak with divergencies.
McClellan Oscillator - above zero with divergences.
McClellan Summation Index - buy signal with divergence.
Weekly Stochastic of the Summation Index - buy signal with divergence.
Bullish Percentage - above 70 with divergence.
Percent of Stocks above MA50 - above 75 with divergence.
Advance-Decline Issues - multiple divergences.
Fear Indicator VIX - with divergence.


HURST CYCLES
Short term cycles - the alternate scenario playing out third 20d cycle - a day or two left.
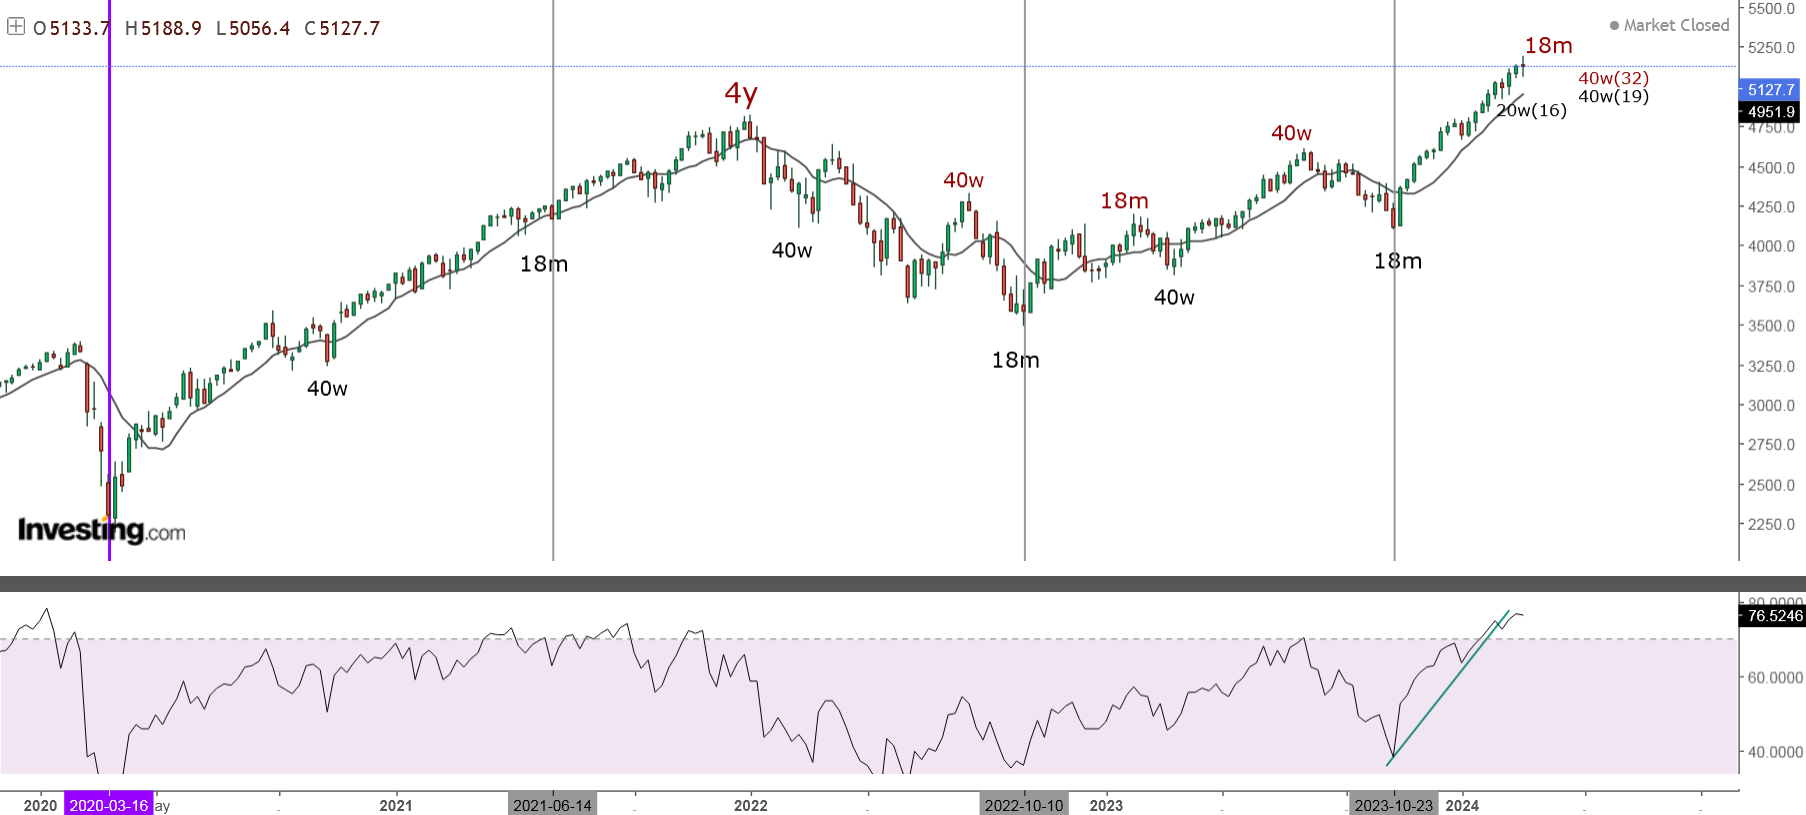
The highs look like three extended 10w cycles for 40w cycle high, with two extended 5w cycles consisting of three 20d cycles.
The lows - no clear 20w low probably the two red weeks in March at week 20.


Week 21 for the 40w cycle. I expect 40w cycle vusialy consisting of three extended 10w cycles.
Week 34 high-to-high, at the top of at least 40w cycle... most likely 18m cycle high.
Average length for the 40w cycle is 32-36 weeks the last 40w low was 33 weeks long and now the high is 34 weeks long maybe the market is back to normal rhythm after shorter cycles from mid-2022 to mid-2023. In this case next important low is in June and next important high in November.
This should be 18m high in this case decline into 18m low should start and this low should be in Q1.2025 right on time for 2.5y(7y)/4y(9y) cycle low - see the two charts below.


Closer look at the 7y and Hurst 9y cycles. Interesting is how they live together and intertwine. The first one makes a nice hit in 2009 the second explains the 2020 crash. The most interesing part is how the next 2.5y /4y and 7y/9y cycle lows converge together.
The explanation is very simple at a low of higher degree waves with different lengths bottom at the same time - example all 5w,10w,20w cycles will bottom at the same time at 40w low.
The 7y/9y cycles bottoming at the same time means cycle low of higher degree is expected in 2029 - most likely the 54y cycle from the seventies.... or even longer.

The seven year cycle(red) has a great hit in 2002/2009, does not explain the 2020 crash which is important pattern dividing the rally from 2009 in two, but fits perfect with the strength from the last important low.
The most interesting part is the sequence of long/short cycles.... which will explain the last short cycle and the strength - this is my mistake not paying attention to cycles longer than 4y and how they work together.

The nine year cycle(red) has a hit in 2002, miss in 2009(my explanation seqular reversal gold/usd in 2011 and maybe pattern low in 2011), explains the 2020 crash. This cycle suggests that the next decline should be something more than 5% pullback.

Mar 16, 2024

Weekly preview

Nothing new the market looks tired, since the start of March every pop is met with quick sell off - it looks like distribution. The pattern is very choppy and short term looks like completed wave c/y/Y alternate triangle top around FOMC.
Week 33 high to high in the 32-36 range for 40w high, very weak market breadth, divergences - classical top.
The 40w cycles are back to their average length so in this case next is decline into 40w cycle low first half of June and higher for 40w cycle high around the elections in November.


TRADING
Trading trigger - sell signal, extended cycles 50+ days.
Analysis - at the top. Important turn lower - waiting for confirmation next week.
P.S. - for a trade both analysis and trigger should point in the same direction.


TECHNICAL PICTURE and ELLIOTT WAVES
Short term - very complex and choppy pattern completed c/y/Y or triangle.


Intermediate term - two double zig-zags for w-x-y at two Fibo targets. Close below the trend line and MA10, RSI breaking lower - very high probability that we have turn lower.


Long term - 4y cycle high the end of 2021, now a-b-c lower. Alternate this is the top of wave-B from 2009.


MARKET BREADTH INDICATORS
Market Breadth Indicators - very weak, divergencies, turned lower.
McClellan Oscillator - below zero.
McClellan Summation Index - buy signal, divergence.
Weekly Stochastic of the Summation Index - buy signal.
Bullish Percentage - above 70, divergence.
Percent of Stocks above MA50 - divergence and turned lower.
Advance-Decline Issues - multiple divergences and turned lower.
Fear Indicator VIX - multiple higher lows.


HURST CYCLES
Short term cycles - very likely 20d high to complete 5w/10w high, alternate third 20d cycle high around FOMC.
The highs look like three extended 10w cycles for 40w cycle high. The lows - no clear 20w low, vusualy probably three extended 10w cycles like the highs. Trying to stick to the theory 20w low in February at week 16 or another extended cycle.


Week 20 for the 40w cycle. Probably 40w cycle consisting of three extended 10w cycles, but if I have to pinpoint 20w low it should be at week 16.
Week 33 high-to-high, at the top of at least 40w cycle... and very likely 18m cycle high too.
Average length for the 40w cycle is 32-36 weeks the last 40w low was 33 weeks long and now the high is 33 weeks long maybe the market is back to normal rhythm after shorter cycles from mid-2022 to mid-2023. In this case next important low is in June and next important high in November.

Mar 9, 2024

Weekly preview

The market NVDA moved higher gapping every day... and trapped many on Friday with sharp reversal.
We have one more 20d cycle high, 40w high at week 32, indicators and market breadth with multiple divergences. The market is at important top and next is decline into May/June for 40w low.

As expected zero answers from all the "smart traders". They have no plan it feels sooo good I wish it will continue forever. To summarize the usual emotianal crap and nonsense with no plan:
- you are wrong so no decline - finding excuses, completely clueless.
- it is higher 8000 points(NDX) so no decline - extrapolating the past into the future.
- yields lower so no decline - history says the opposite every 4 years yields and indices decline in sync.
- AI will change the world NDX 50k so no decline - probably some young guy with zero experince, riding all this hype, gamification of trading never seen a decline - read history adoption of new technologies quick check Internet and dotcom bubble.
To be fair two weeks ago someone posted the main stream EW count impulse from 2009 and now the top of iii/5 ending diagonal. There is no impulse and the ED is very suspicious, best case there a-b-c from 2009 and this is iii/c ending diagonal with the same result. At least the guy has a plan which can be adjusted when we see the next decline.... all the others are just believers that the good times will last forever - I have news for you the good times are gone, all it is left is the sugar high the paper wealth.


TRADING
Trading trigger - buy signal.
Analysis - at the top. Important turn lower - waiting for confirmation next week.
P.S. - for a trade both analysis and trigger should point in the same direction.


TECHNICAL PICTURE and ELLIOTT WAVES
Short term - looks like corrective w-x-y with plenty of zig-zags... difficult to see impulse.


Intermediate term - two double zig-zags for w-x-y at two Fibo targets. This should be the top of corrective B-wave and C-wave for a flat should follow. Alternate this is a-b-c from the 2020 low and the top from 2009.


Long term - 4y cycle high the end of 2021, now a-b-c lower, alternate this is the top from 2009.


MARKET BREADTH INDICATORS
Market Breadth Indicators - weak with divergences.
McClellan Oscillator - above zero, multiple divergences.
McClellan Summation Index - very weak buy signal.
Weekly Stochastic of the Summation Index - buy signal.
Bullish Percentage - divergence.
Percent of Stocks above MA50 - divergence.
Advance-Decline Issues - multiple divergences.
Fear Indicator VIX - multiple divergences.


HURST CYCLES
Short term cycles - choppy moves makes it difficult to count shorter cycles. The highs look like three extended 10w cycles, 5w cycle high in the middle and three 20d cycles to complete 5w/10w/40w cycle high.
The lows - sticking to the theory 20w low in February, but vusualy probably three extended 10w cycles too.


Week 19 for the 40w cycle. Probably 40w cycle consisting of three extended 10w cycles, but if I have to pinpoint 20w low it should be at week 16.
Week 32 high-to-high, at the top of at least 40w cycle... and very likely 18m cycle high too.
Average length for the 40w cycle is 32-36 weeks the last 40w low was 33 weeks long and now the high is 32 weeks long maybe the market is back to normal rhythm after shorter cycles from mid-2022 to mid-2023.

Mar 2, 2024

Weekly preview

Completed pattern another double zig-zag y for w-x-y with y=0.618xw with multiple divergences and bad market breath at week 31(32-36 average). This are strong bullish signs and the momentum is strong with the histogram flat at the zero line(I hope you get the sarcasm)
DAX and bitcoin joined the euphoria to complete their patterns... on youtube - "buy bitcoin last chance to get rich" no comment:)

I have posted 30+ years MSFT chart and three charts last week - show me how they are wrong and how a strong bull market is running... because I am so wrong show me how right and smart you are.


TRADING
Trading trigger - buy signal.
Analysis - at the top. Important turn lower next week.
P.S. - for a trade both analysis and trigger should point in the same direction.


TECHNICAL PICTURE and ELLIOTT WAVES
Short term - either w-x-y double zig-zag or less likely a-b-c zig-zag with running correction b-wave.


Intermediate term - two double zig-zags for w-x-y at two Fibo targets. Another view with line chart.
This should be the top of corrective B-wave and C-wave for a flat should follow.
Alternate this is expanding ending diagonal from the 2022 low for a-b-c from the 2020 low and the top from 2009.


Long term - 4y cycle high the end of 2021, now a-b-c lower, alternate this is the top from 2009.


MARKET BREADTH INDICATORS
Market Breadth Indicators - weak with divergences.
McClellan Oscillator - around zero, multiple divergences.
McClellan Summation Index - very weak buy signal.
Weekly Stochastic of the Summation Index - buy signal.
Bullish Percentage - below 70 with divergence.
Percent of Stocks above MA50 - below 75 with divergence.
Advance-Decline Issues - multiple divergences.
Fear Indicator VIX - multiple divergences.


HURST CYCLES
Short term cycles - probably bounce of 20d low and higher into 20d high, lets see if there is another day or two left.
Intermediate term - mature 10w and 40w cycles, the 40w cycle high/low divide better in three with no clear 20w high/low.


Week 18 for 40w cycle. I expect 40w cycle low around June consisting of three extended 10w cycles.
Week 31, at a high of at least 40w magnitude... and very likely 18m high too.