Feb 29, 2020

Weekly preview

There is only one word for this - MASSACRE. Watch south park - aaaand it's gone:))) this is what happened this week.
Short summary with all the excuses and bullshit how the market will reward everybody for ever - what were you thinking guys?
- I am so wrong with my correction and the great market keeps on giving - aaaaand it's gone for 5 days half of it evaporated.
- the buy and hold crowd proud with their returns - aaaaand it's gone, back to the 2018 highs where the correction begun so back to zero two years later.
- the "right count" with third wave - aaaaand it's gone, went down the drain where it belongs.
- economic models, scientific proven, funnymentals - aaaaand it's gone, model this:) it is about emotions fear and greed people are irrational not rational. EW models this not some economic models.
- "I will exit when it turns negative" - aaaaand it's gone, I bet most just watched like a deer in headlights:)
- TA or EW does not work, FED is printing - aaaaand printing is gone:) back to TA like MA200 trend lines etc.
- trolls trying to ridicule me how wrong I am - aaaaand they are gone, have not herd them lately:) now they look mega stupid as always - three times for two years and learned nothing, pure stupidity....

To sum it up the market punished the stupid greedy clueless herd.... as always and it is left holding the bag as always.
I let all this comments with the intention the traders to look back and learn something from their mistakes - keep cool head do not let to be sucked in from extreme emotions greed/fear.... but first this is naive the herd will never learn, second this time it was so extreme with insults like "xxxx dog" why do not I obey the herd and switch to third wave. This will not happen again... such comments will be deleted. Imagine what will happen in a few years when the bull market will end.

P.S. please spare me the bullshit - I got lucky, coincidence, virus blah blah. It is not coincidence it is pattern cycles and emotions. If you can not see them it is your problem not mine.
P.S. waiting for the "not confused expert" xyz to explain me EW and the third wave because I am now really confused - is this wave 4?


Now lets try to find out the real right pattern, it is all that matters the pattern everything else is irrelevant.
Nothing usual with this move the fastest 10% lower ever, but the usual outcome is short covering then test of the low(sometimes lower low sometimes higher low) then retracement - the traders should forget the pain and the indicators/market breadth should reset from extreme oversold levels.
- From cycle perspective we should see 5w high next week and 5w low the second week of March so this fits with short covering and test of the low. In April we should see 10w cycle high - probably the retracement/reset phase. This looks like confirmed 4y cycle high to me so we should not see higher high until the 4y cycle low in June. This is the time plan.
- From pattern perspective - two options w1/C for expanded flat or a zig-zag lower for big W-X-Y or some ED. SP500 has exactly the right size for 1/C to complete C around 2200, but if you look at NYSE it is way too big so I will give 50:50 to the two options at the moment. In both cases we should see something higher w2 or b before continuation lower. First we need a bottom of course:)
- Market breadth/indicators - extremes like December.2018 too much fear too fast, we should see intermediate term low and weeks higher. Healing fear and resetting the indicators takes time so I will not be surprised to see 5-6 weeks retracement. This makes the zig-zag option more likely from time perspective.


TECHNICAL PICTURE and ELLIOTT WAVES
Short term - it is so strong looks like impulse... well it is not so clear. We need at least one more low for impulse. AAPL below shows the case more clear.
It looks like prefect impulse, but still we need slightly higher and a new low. If this does not happen we have only zig-zags.


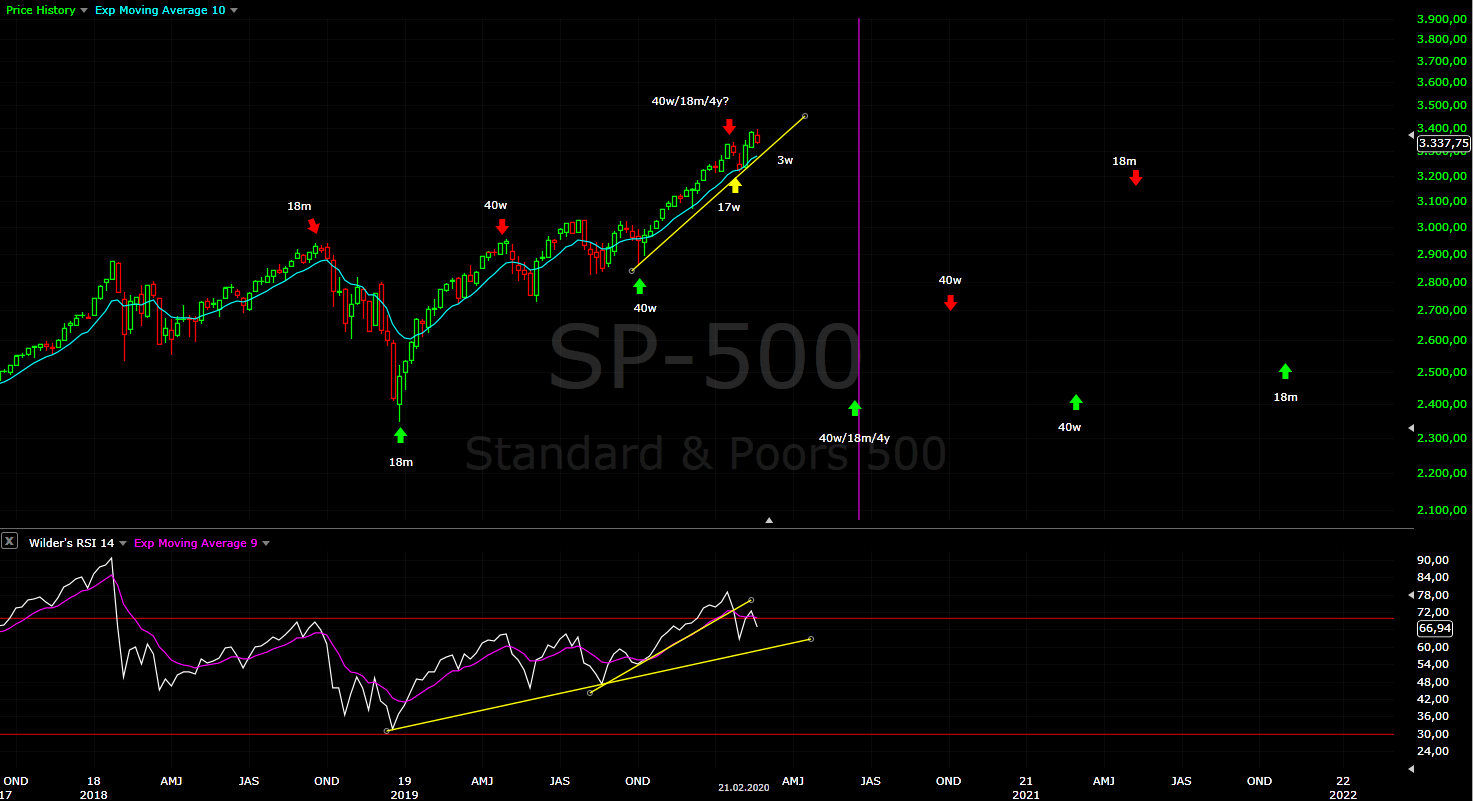
Intermediate term - I was too bullish with 2-3 weeks lower to 38% Fibo level:) Again if this is w1/C projecting impulse with standard Fibo measurements points to my target area 2200, but I will be careful because it is too big for other indexes. We have time window so I will just watch what happens in June.
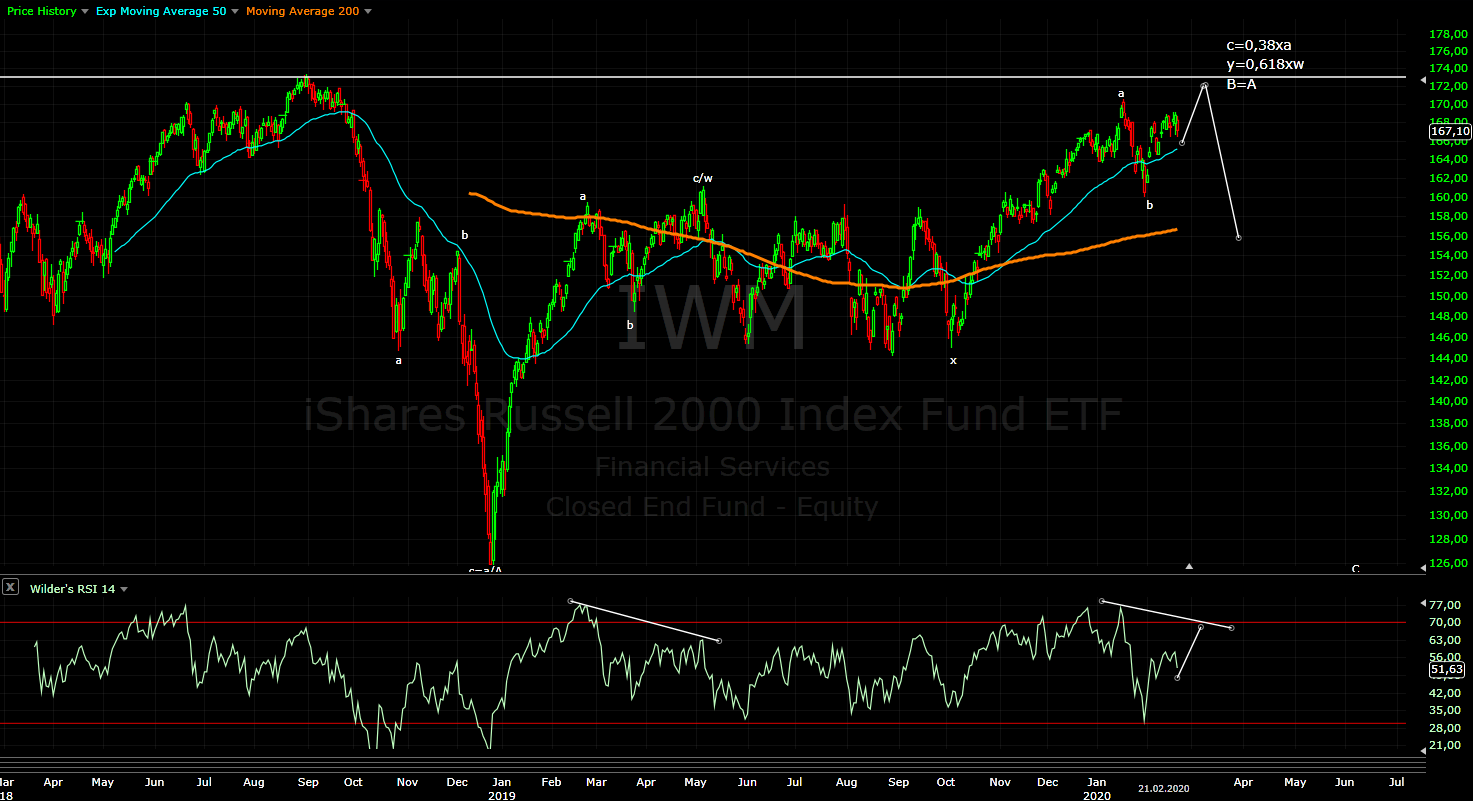
Watch RSI we should similar price action like Nov.2018. When you see RSI close to the trend line the first half of April and the price in the target area 50%-62% it is time for the next leg lower.

DJ gives interesting perspective. Look at the symmetry above MA200 and below MA200. Next we should see retracement to the broken trend line. It looks like H&S, many other indexes XLF,RUT etc. have such pattern.


Long term - the move from Dec.2018 is over. Decline into important low in June is running. The two scenarios ares C for expanded flat or a zig-zag.


MARKET BREADTH INDICATORS
Market Breadth Indicators - extremely oversold, many at levels seen in December 2018. We should see up and down with divergences for an intermediate term low.
McClellan Oscillator - extreme level, I have not seen such.
McClellan Summation Index - sell signal.
Weekly Stochastic of the Summation Index - sell signal, in oversold territory.
Bullish Percentage - sell signal, oversold.
Percent of Stocks above MA50 - sell signal, extremely oversold.
Fear Indicator VIX - extreme level 50, it should cool of for weeks.
Advance-Decline Issues - reached extreme oversold level.


HURST CYCLES
Daily(trading) cycle - not much to explain sell signal with extremes. Price and RSI way too far from the MAs and they should try to test the moving average. The usual length of this cycles is 35-45 days. Currently we have 19 days and price is moving way too quickly so I think it should be shorter like 30 days... which will synchronize it with Hurst 40d/5w cycle low.


Hurst cycles - the same like last week. The first week of March we should see 5w high and the around mid-March 5w low.


Week 4 for the 20 week cycle.
Quote from last week says it all - "We should see spectacular decline into the 4y cycle low because first it is compressed in time and second it follows vertical patterns.... and they always end the same way - vertically lower."

Feb 22, 2020

Weekly preview

Currently what I see:
- the indicators does not look good, market breadth with sell signals, reversal daily and weekly candles (confirmation needed), sell signal triggered - bad looking close below MA10.
- the pattern - from the January low I see zig-zag higher and zig-zag lower. At the moment there is neither complete pattern nor reversal pattern.
- time - from cycle perspective the ideal time for a top is the first week of March - more below in cycle section.

My opinion at the moment - we should see one more high for completed pattern. If we have reversal we should see acceleration lower next week for a third wave to negate the zig-zag pattern lower.


TECHNICAL PICTURE and ELLIOTT WAVES
Short term - at first it looks like impulse, but I do not see such for the other indexes or the futures. I think it is a-b or some ED running. Again as long as it stays above 3300 we should see move higher, for something bearish we should see acceleration below that level.

NYSE again with more clear picture, many indexes have this zig-zag up/zig-zag down pattern. For a top I want to see NYSE making higher high to synchronize with DJ/SP500... it does not make sense if they have different patterns.


Intermediate term - the indicators do not look so good. Waiting for the move up to be completed after that expect MA200 to be tested.
In arithmetic scale after one more high we will have two legs up with roughly the same size.... zig-zag corrective pattern.
Below DJ and RUT how I see a complete pattern. It is the same for SP500 just this indexes show it more clear. The outcome for the both patterns is the same it is just the labeling and they will hit the high at the ideal cycle time for a top.

DJ with ED for c/y/B.

RUT with series of zig-zags including all four a and c waves.


Long term - close to the top of wave B, once completed we should see sell off into the end of Q2.2020. It will complete the correction which begun in January 2018. Alternate scenario shorter impulse C for running flat, less likely zig-zag lower w2 for a big ED.


MARKET BREADTH INDICATORS
Market Breadth Indicators - the same weak with divergences, pointing lower and sell signals.
McClellan Oscillator - below zero, divergences.
McClellan Summation Index - sell signal with divergences.
Weekly Stochastic of the Summation Index - sell signal.
Bullish Percentage - divergence, turned lower.
Percent of Stocks above MA50 - below 75, pointing lower with divergence.
Fear Indicator VIX - series of higher lows, the next big move is spike higher most likely in March.
Advance-Decline Issues - turned lower with double divergence.


HURST CYCLES
Daily(trading) cycle - roughly 1/3 of the cycle. Sell signal was triggered - the price is below MA10, RSI below MA18, the price broke the trend line. As expected this cycle is weaker than the previous two.
At the moment I am ignoring the signal and giving preference to EW+cycles. I could be wrong, but I want to see either completed pattern or reversal pattern and there is no such at the moment.


Hurst cycles - the first two cycles look perfect 15 days high-to-high for the 20d cycle and lower, now we have day 15 low-to-low for possible 20d cycle low(not confirmed yet). Why is the first week of March interesting for a top:
From high-to-high perspective I am expecting to see 5w high before the markets turn lower. This is 2x20d cycles or the first week of March.
From low-to-low perspective we have new 20w cycle running so I think the minimum is one 20d cycle higher(check) then the second 20d cycle should "fail" and revers around the middle of the cycle or before that - another 6-8 trading days higher is again the first week of March.


Week 3 for the 20w cycle. Weaker as expected - DJ,NYSE,RUT are struggling below the previous high, SP500 around it. It is all about the tech stocks - many of them completing w3 from 2009 and many with vertical moves. We should see spectacular decline into the 4y cycle low because first it is compressed in time and second it follows vertical patterns.... and they always end the same way - vertically lower.

Feb 15, 2020

Weekly preview

Last week more price action was needed for the pattern to take shape and after this week it looks like ED. For confirmation we should see one more high followed by steep decline below 3300.
If we see move lower without one more higher high than it is the bigger ED which I showed last week in comments.


TECHNICAL PICTURE and ELLIOTT WAVES
Short term - it looks like diagonal structure, but no overlapping on the cash index. There is overlapping on the futures and other indexes - DJ,NYSE,RUT.
For something bullish we should see only zig-zag above support and MA200. Break below this level and with high probability we have a reversal.

NYSE it looks like ED with overlapping - it makes more sense to see completed ED squeezing marginal higher high so that the big pattern is synchronized across the indexes.


Intermediate term - the fifth wave shown last week is taking the shape of a wedge. This pattern once completed is fully retraced so next target should be support around 3215. If H&S is confirmed target is important support and MA200. The indicators does not suggest something bullish.


Long term - at the top of wave B, next we should see sell off into the end of Q2.2020. It will complete the correction which begun in January 2018. Alternate shorter impulse C for running flat, less likely big ED.


MARKET BREADTH INDICATORS
Market Breadth Indicators - do not follow price higher, weak and divergences.
McClellan Oscillator - slightly above zero with double divergence.
McClellan Summation Index - turned up but very weak below the MA, this is still sell signal.
Weekly Stochastic of the Summation Index - sell signal.
Bullish Percentage - turned up with divergence.
Percent of Stocks above MA50 - below 75 with divergence.
Fear Indicator VIX - double divergence, next we should see spike higher.
Advance-Decline Issues - double divergence.


HURST CYCLES
Daily(trading) cycle - the trend line touched two more times, the signal is still buy. With this diagonal pattern and the divergences it could change very rapidly.


Hurst cycles - 10 days higher, we should see a high next week. With RSI double divergence it does not look so bullish.


Week 2 for the last 20 week cycle, making higher highs at week 19 does not make sense plus my indicators are pointing to a 20 week low.

Feb 8, 2020

Weekly preview

I was expecting bounce higher from MA50 daily and deep retracement 62% or more... but this impulse really surprised me. Technically nothing changed - RSI testing the broken trend line with divergence, market breadth with sell signals, cycles tricky if we have 20w cycle low or not. I still think this is an important top and it loks like exhaustion move with this gaps and bearish candle formation at the end of the week. Many indexes has not made higher high which is a red flag and happens around tops - NYSE,RUT,DJT,SOX,EEM,SVXY(volatility).


TECHNICAL PICTURE and ELLIOTT WAVES
Short term - it looks like impulse.... at the moment there is no enough price action to confirm it or forecast what happens next, we have to wait.
For something bullish a pullback should stay above 3295-3300, below that it is bearish.


Intermediate term - another possible count impulse higher with really extended third wave to the max 4,236, 5=1 and 4=0,236x3 what you expect in extended wave. The third wave itself has extended first wave which I explained once iii=0,618xi and v=0,38xi. Now we wait for confirmation or not... or maybe this final wave 5 is ED and this is wi, it will fit with cycles 2-3 weeks higher, at least the Fibo levels look perfect:)
The indicators - MACD/RSI broke the trend line from the October low and found support at the trend line from Dec.2018. Now RSI is testing the broken trend line and we have divergences. The indicators look bearish. The move looks like exhaustion with this gaps and bearish candle formation... on DJ it looks really bad like strong reversal.
For those who think the market is bullish any move lower should stay above the red line 38% retracement and support. Below that with high probability the third wave is dead.


Long term - at the top of wave B, next we should see sell off into the end of Q2.2020. It will complete the correction which begun in January 2018. Alternate shorter impulse C for running flat.


MARKET BREADTH INDICATORS
Market Breadth Indicators - some turned up... but I do not see bullish signs most with sell signals and divergences.
McClellan Oscillator - returned above zero after slightly oversold levels and divergence, now turned lower again.
McClellan Summation Index - sell signal.
Weekly Stochastic of the Summation Index - sell signal.
Bullish Percentage - divergence, this time did not follow the indexes higher.
Percent of Stocks above MA50 - divergence and turned lower.
Fear Indicator VIX - testing the trend line as expected, next we should see spike higher.
Advance-Decline Issues - around zero and testing the broken trend line, next it should plunge lower to oversold levels.


HURST CYCLES
Daily(trading) cycle - we have the next daily cycle the price above MA10... but we have already two right translated cycles in a row so the probability for a third one is low plus as discussed RSI does not look bullish rather bearish. For something bullish we have to see shallow pullback to test MA10 and the trend line. I think the probability to see left translated cycle is very high.
So the signal is buy - if we see shallow pullback testing MA10 and turn high you have long entry point, if we see the price below 3300 we have failed left translated cycle which is bearish.


Hurst cycles SP500 20d sine wave highs - currently it looks like it is turning lower early at day 11 which is bearish. We have already 8x20 cycles so the next 20w cycle should be running.


Now there is two options - 20w low behind us and the next 20w cycle is running or 40w cycle high this week and 20w low in the next 2-3. weeks. We need more information(price action) to confirm which one it is. In the first case we have important high and we should see bigger move lower. In the second case we should see corrective move lower for 2-3 weeks and the price should stay above the 3150-3200 range.
The signs are pointing that we have new 20w cycle running:
- first the index broke below the trend line, RSI broke below MA9 which usually signals new cycle.
- second the daily chart above we had already 8x20 cycles for 20 week cycle high.
- third when you expect a high and you have strong right translated cycle usually the next one is making higher high and reverses for M pattern aka double top.... what we

Feb 1, 2020

Weekly preview

Second bearish weekly candle with market breadth in sell mode... now it is confirmed - the 20 week cycle turned lower and the indices will move lower for a few weeks.
What is much worse on the last day of the month big sell off and we have bearish monthly candle instead of nothingburger - indecision candle. I was watching and expecting such candle, but with only one day left I gave up and the market makes what you expect in the most unexpected way:)


TECHNICAL PICTURE and ELLIOTT WAVES
Another short term pattern from Kris which looks better.

Short term - all possible patterns I see are - impulse with extended fifth wave 5=1to3, zig-zag with a=c for "a" of a bigger zig-zag or diagonal(yellow) if we see a bigger pop up next week. It sounds complicated, but it is not because all three have the same path - final up and down for the pattern to be completed then retracement higher.
Looking the MACD/RSI divergences it is hard to imagine that the move is just starting to accelerate.

Not so complicated AAPL it looks like impulse 1-2-3 and probably H&S top formation.


Intermediate term - TA looks interesting... the market does not start big sell off when it is above MA50 first you see a bounce with lower high or higher high with divergences then a bigger sell off follows and currently MA50 is being tested so we should see a retracement higher.
The indicators MACD/RSI breaking the trend lines from the October low. If we have just small a-b-c for iv/3 the next lower trend line will be tested and the price will turn higher again.
Look at RSI - often when you have fourth wave RSI breaks the trend line which is early warning and moves deeply lower, but stays above 50 - see the circles it happens all the time. If this is small degree wave iv/3 not even 4 why is RSI below 50? Why in the middle of the third wave we have bearish monthly candle? Just asking the bulls, I now the answer there is no third wave in the first place.
I expect bigger decline and it should test the area around support(the previous four peaks), MA200 and 38% retracement.


Long term - wave B should be finished, expect the sell off to continue into Q2.2020. It will complete the correction which begun in January 2018. Alternate scenarios - three waves lower for C triangle or impulse C for running flat.


MARKET BREADTH INDICATORS
Market Breadth Indicators - turned lower with sell signals.
McClellan Oscillator - second slightly oversold level with divergence.
McClellan Summation Index - sell signal.
Weekly Stochastic of the Summation Index - sell signal.
Bullish Percentage - sell signal.
Percent of Stocks above MA50 - sell signal.
Fear Indicator VIX - it looks like we have an impulse higher and I think it should test the broken trend line connecting the highs, then we should see big spike higher.
Advance-Decline Issues - heading lower and broke below the trend line connecting all the lows from Dec.2018.


HURST CYCLES
Daily(trading) cycle - the signal is sell. I have paid too much attention to the divergence on the 1h/4h chart and ignored the entry point - the price was rejected four times at MA10.... my mistake. It is not fatal I think we will have another chance. RSI is moving too far too quickly from the trend line and MA18 so it should snap back and this will be another entry point.


Hurst cycles - SP500 20d sine wave. The question is when to expect 20w low? The Hurst guys are counting short half cycle(only 3x20d cycles) and from there another 10 weeks or 4x20d cycles with a low mid-February(red arrow). Full 20w cycle with 8x20d cycles is the first week of March(black arrow). We can only wait and watch how the pattern develops. If I am right that we have B wave the decline should be bigger and take longer or late February/first week of March.


Week 17 for the 20 week cycle, which with high probability turned lower. Based on the high-to-high count which is minimum 40w cycle high I expect to see a bigger decline than most expect.