Trading trigger - buy signal.
Analysis - sell the rips, long topping process.
P.S. - for a trade both analysis and trigger should point in the same direction.

TECHNICAL PICTURE and ELLIOTT WAVES
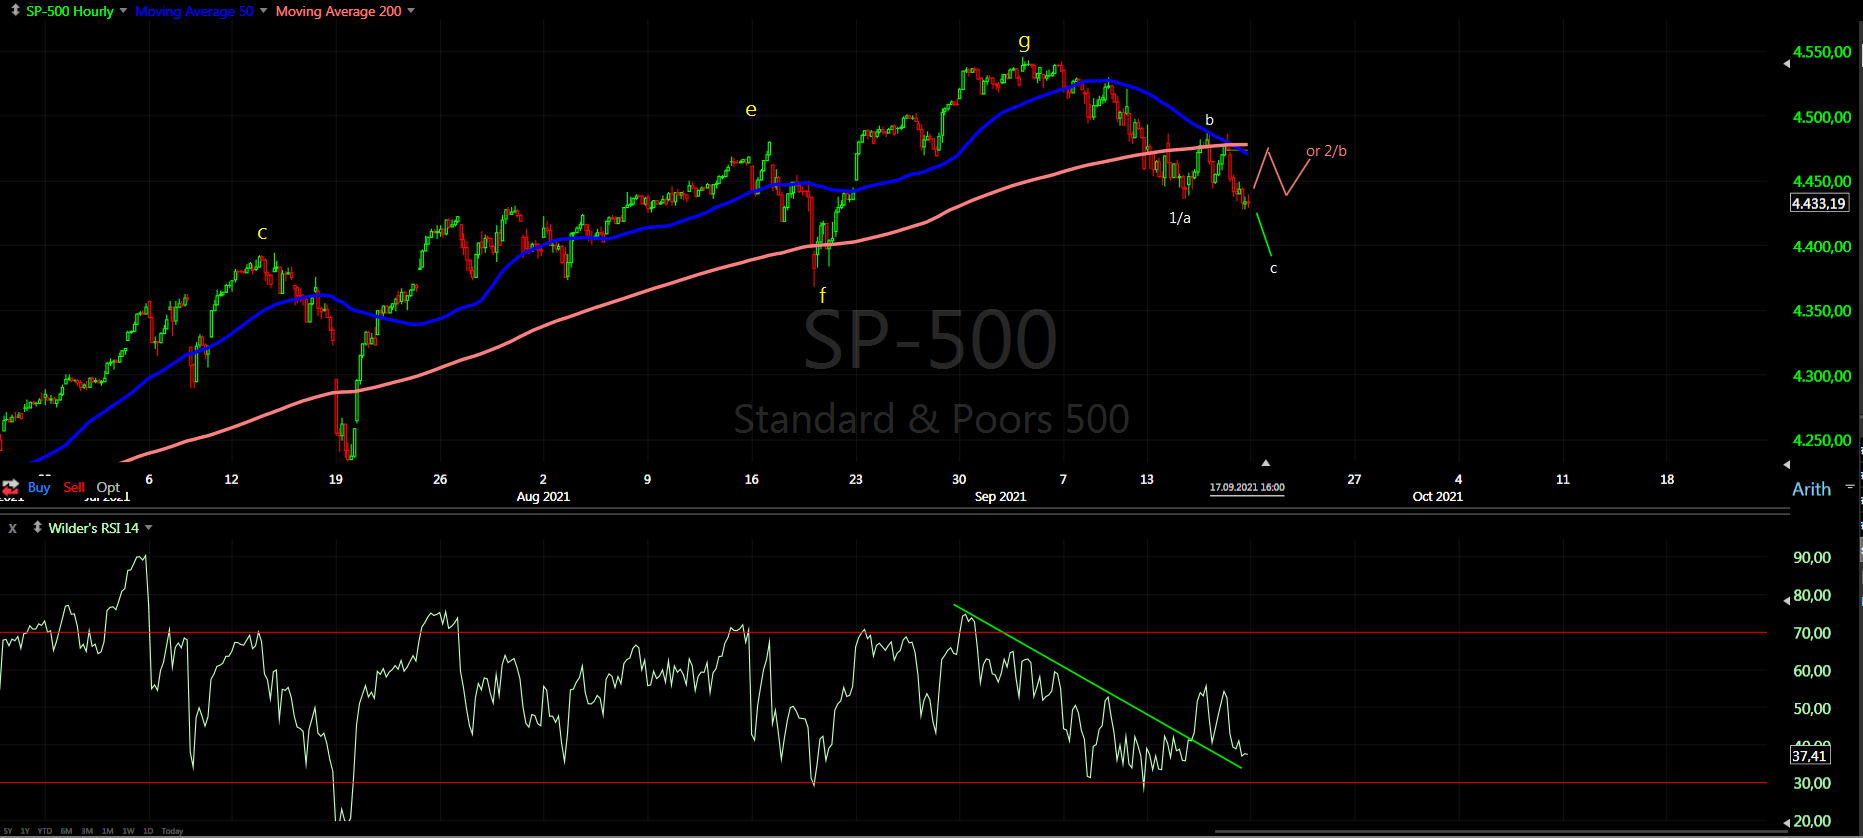
Short term - a-b-c lower, now waiting to see the move up.... it will be another zig-zag for sure. The question is how high, according to cycles it is not over.

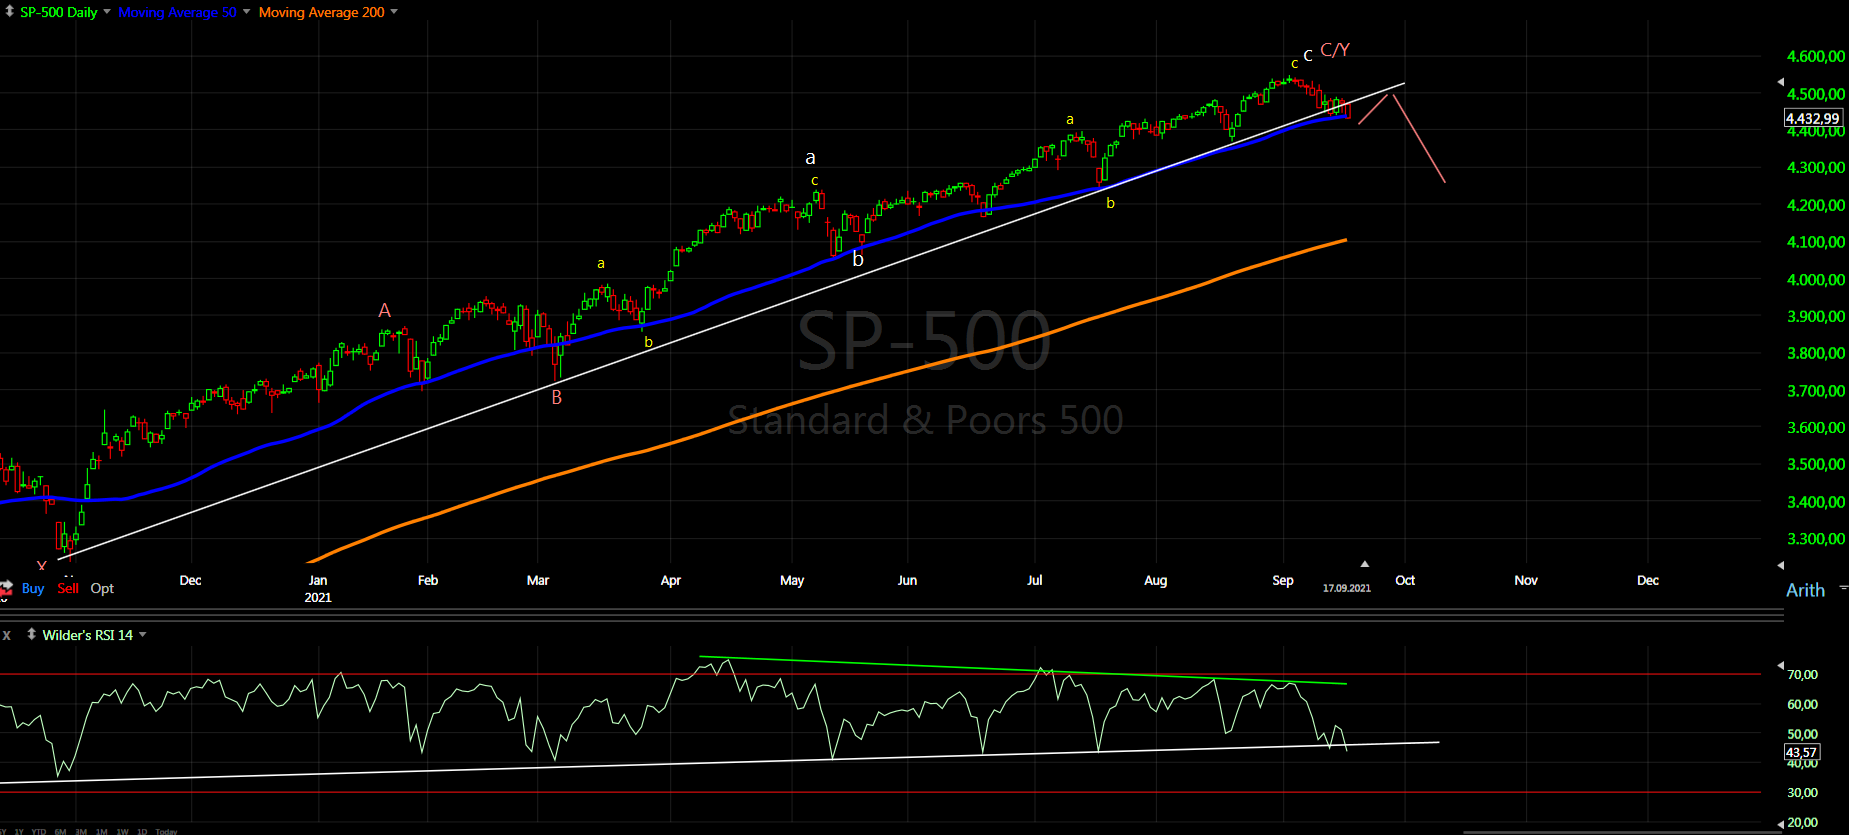
Intermediate term - from the March low we have one big zig-zag consisting of two zig-zags, which itself consist of zig-zags. You can call it W-X-Y, but there is no impulses. Waiting to see how the next high will look like just test of the broken trend line or something more. We have some technical damage weekly RSI breaking the trend line and VIX breaking the trend line connecting the highs from the March.2020 low. This are the first signs that the tide is turning.

Long term - topping process running for months and maturing. Some kind of b-wave and c-wave will follow.

MARKET BREADTH INDICATORS
Market Breadth Indicators - oscillators turned up. There is no signs for important low, but according cycles it has the potential to last for 1-2 weeks.
McClellan Oscillator - around zero.
McClellan Summation Index - sell signal.
Weekly Stochastic of the Summation Index - sell signal.
Bullish Percentage - turned up, in the midle of the range.
Percent of Stocks above MA50 - turned up, in the midle of the range.
Fear Indicator VIX - broke the trend line from the March.2020 top and now retracing.
Advance-Decline Issues - in the midle of the range.
HURST CYCLES
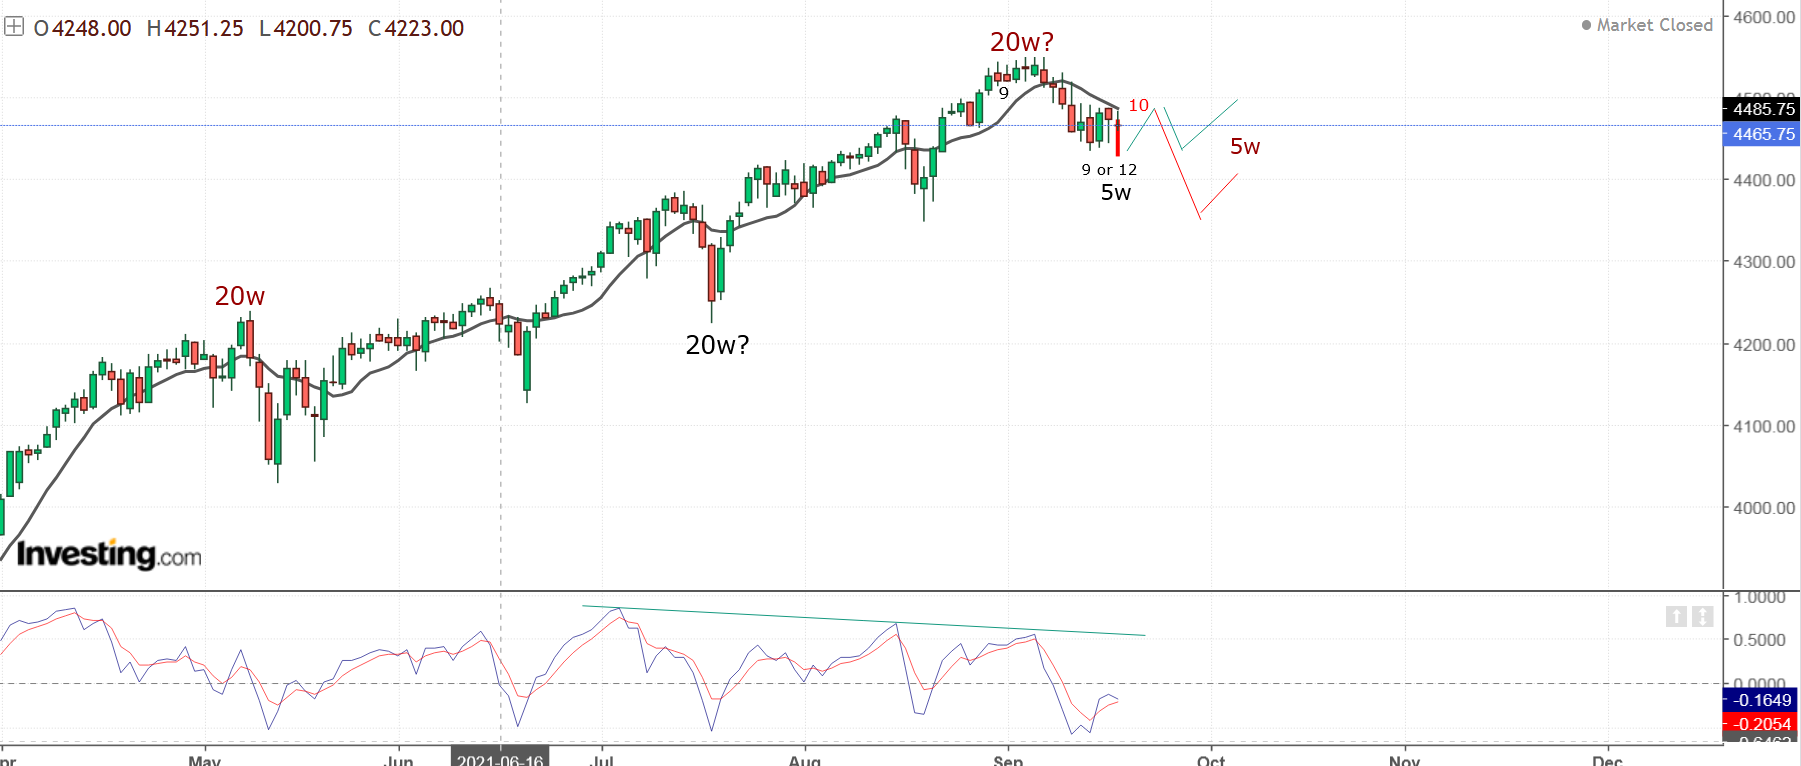
Short term cycles - we saw most likely 10w low and heading higher into at least 5w high which has the potential to be something much more than that.
From the last high this is the third week for the 5w cycle high lasting usually 4 weeks. 9+6 trading days for the two 20d cycles. The usual length is between 9-13 days so at least the second half of next week and it could stretch until 4th-5th of October.

Week 9 for the 20w cycle.
I think this index shows more clear what is going on. Roughly every 4 months you have 20 week high/low as it should be.
The lows are the same like SP500, just the July low is clear defined with 5-6 weeks decline and for SP500 I have compared many indices and used some indicators to identify it - looking only at the chart you will see nothing.
The highs - the previous and the current 20w highs look clear defined and the overall flow high-low is clear and well visible. So the next high should be important at least 20w cycle high.
Short term - https://schrts.co/EeIrtdzN From the June high on every first or second of the month we have 5w high now the fourth 5w cycle running and the first two trading days of October are 1st and 4th, which is the same like the calculations above.
Long term - https://schrts.co/QGysPmWw It all begun in Jan.2018, the 2020 high is nothing more than a b-wave and I think we are at 4 year cycle high. Visually it divides better as two 2y cycles. If you stick to Hurst rules and divide it in three the second 18m high was in early June 2020 and 16 months later right on schedule the third 18m high.