Trading trigger - sell signal. The price is below MA10 and hesitates to rally above it.
Analysis - sell the rips, long topping process.
P.S. - for a trade both analysis and trigger should point in the same direction.

TECHNICAL PICTURE and ELLIOTT WAVES
Short term - still not very clear... crappy impulse wave 1 or a-wave and now in 2/b sideways move completed around FOMC. Less likely continuation lower for c-wave.
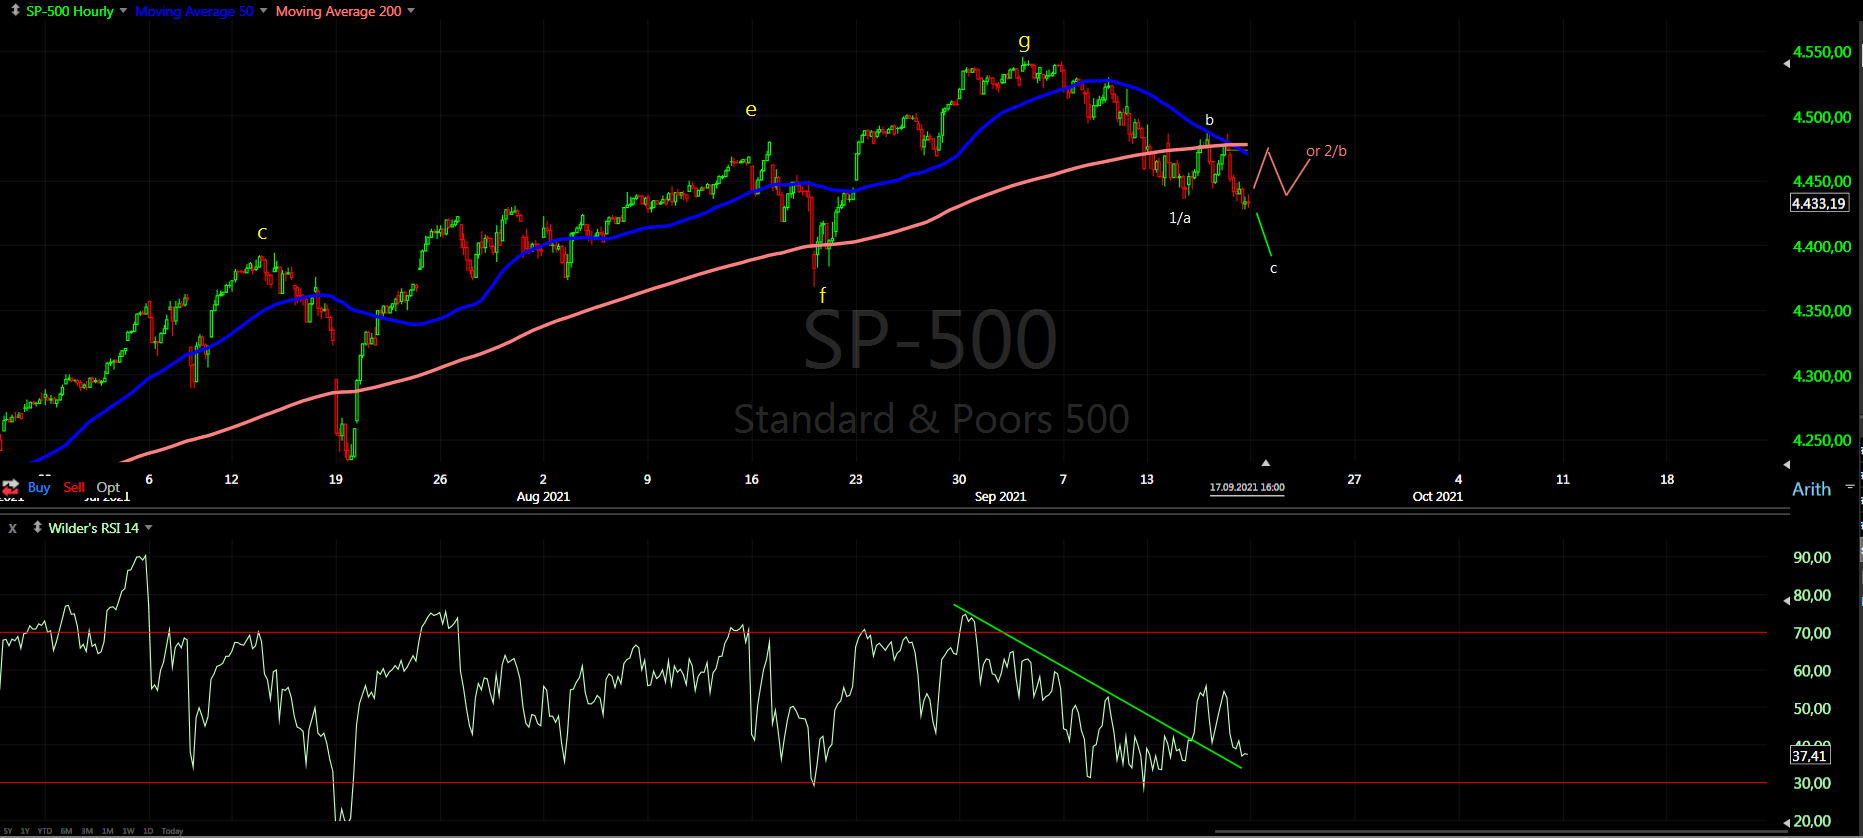
Intermediate term - from the March low we have one big zig-zag consisting of two zig-zags, which itself consist of zig-zags. You can call it W-X-Y, but there is no impulses. Waiting for more price action to confirm intermediate term top. This time the price is struggling at MA50. All the previous 7 occasions were clear - touch and strong up, now it takes days and nothing happens.
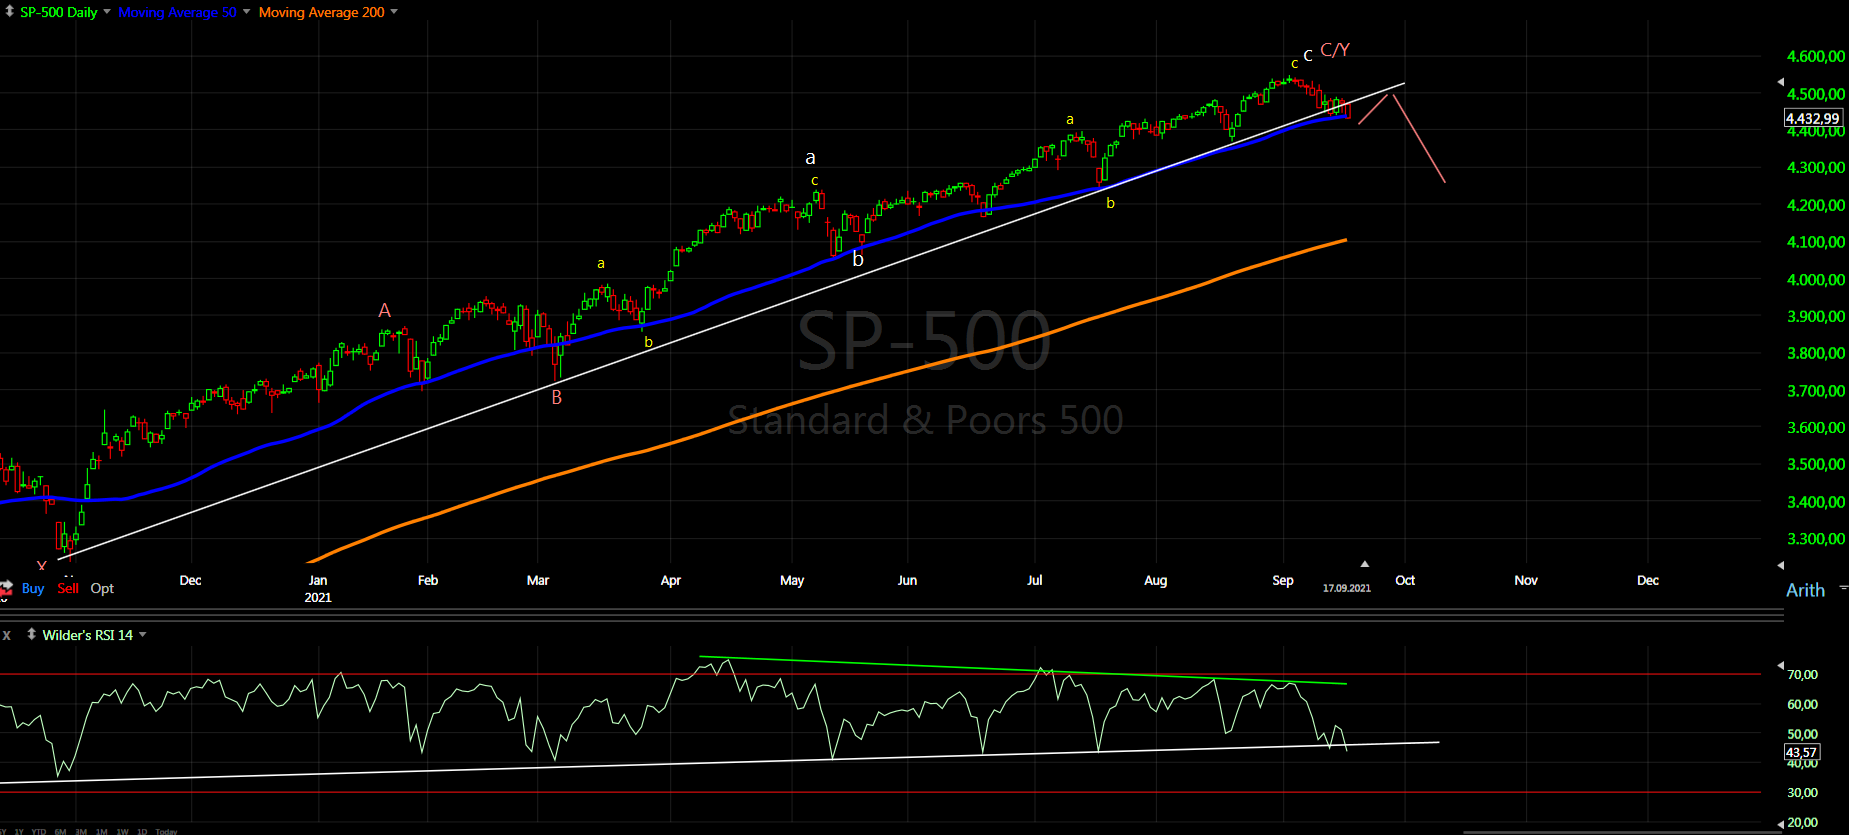
Long term - topping process running for months and maturing. Some kind of b-wave and c-wave will follow.

MARKET BREADTH INDICATORS
Market Breadth Indicators - nothing new, I do not see a sign for a pending low and reversal.
McClellan Oscillator - below zero.
McClellan Summation Index - sell signal.
Weekly Stochastic of the Summation Index - buy signal.
Bullish Percentage - pointing lower.
Percent of Stocks above MA50 - pointing lower.
Fear Indicator VIX - preparing for a spike higher?
Advance-Decline Issues - heading lower.
HURST CYCLES
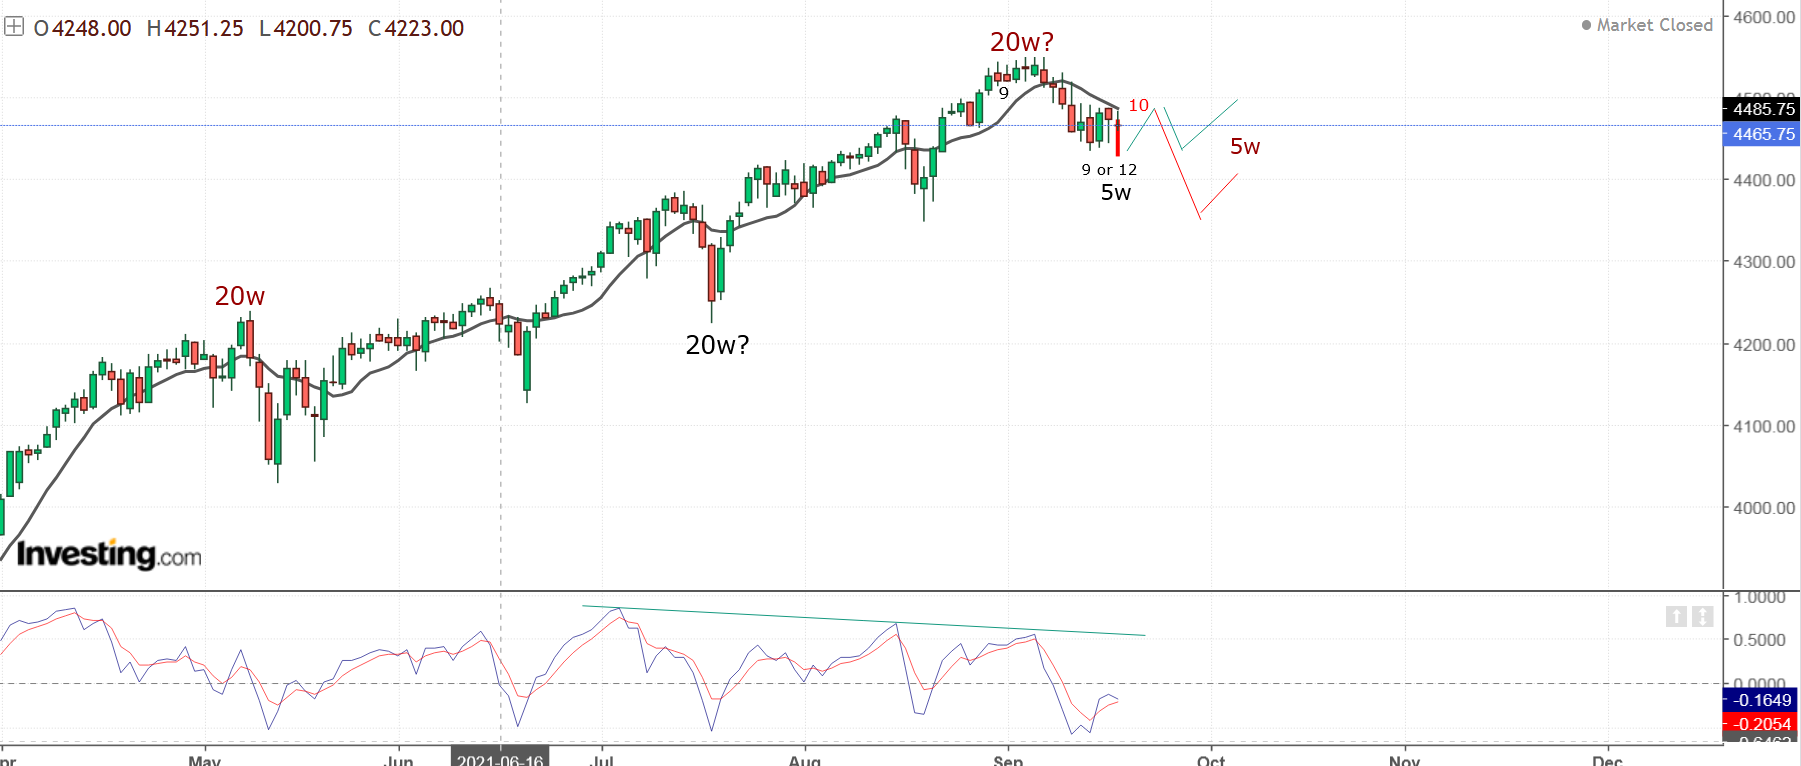
Short term cycles - 20d/5w low was expected this week. I think it was on Tuesday alternate Friday or early next week. Now we are watching for 20d high already at day 10 so it should not last long probably mid next week FOMC.
In the bullish case wee should see 1,5-2 weeks higher(green). In the bearish case the price continues lower and we have consecutive lower highs for the 20d and the 5w highs(red).
It is spending a lot of time below MA10 so with every day the bearish scenarios is getting more likely.
Week 8 for the 20w cycle? You can see how every time we see decline into 20w low RSI crosses below the MA, three times in a row and this is the fourth time - this is a hint that a decline into 20w low is underway.
The long term count is not very clear, there is no visible significant low, the indices do not show consistent picture so we will be sure only in hindsight where the 18m low is. Two options:
- bullish 40w/18m cycle low in September/early October with one extra 10w cycle for the missing one from 2020.
- bearish the 18m low was in July which means to expect decline into 20w low until November. NDX,NYSE,DAX,RUT,DJT have lows in July so this is the low to pick for possible 18m low.... only DJ have the low in June.

The Q's seems to be an impulse with the 3rd wave getting ready for next week. AAPL seems to be saying a top is in on tech. MSFT also, even with buybacks and never better "fundamentals". Thanks Krasi
ReplyDeletehttps://tvc-invdn-com.investing.com/data/tvc_6a36c30ada57b220d1210d49c4053f18.png
This chart shows the "change in price behavior" - https://invst.ly/w2ote
ReplyDeleteSee how all previous cycles are right translated long up phase and short down phase. The last one topped out around 1/3-1/2 of the cycle and we have long down phase. Accordingly the next up phase from the next cycle high should be shorter.
Surely an impulse, Krasi?
ReplyDeleteOnly three so far... if we see one more up down than it is an impulse.
Deletethis week should be 10w low?
ReplyDeleteI think so, I am counting July as important low so yes.
Deletebuyers gone awol
ReplyDeletehead and shoulders possible with the cycles you are following?
Deletehttps://tvc-invdn-com.investing.com/data/tvc_62ce20e18a3251529654f3baa02a7142.png
can you give us an update on your current count? thank you
ReplyDeleteNo change 1/a-2/b-3/c. It feels like third wave, but close to 10w low so let the market play out and show us the pattern.
DeleteI don't see 10w low on the charts above. You show 5w low. Too early to ask but do you expect bounce here and then decline into November for 20w low?
ReplyDeleteIt is the same position like the 5w.
DeleteThe signs are showing decline into 20w low. Between now and this low there should be one bounce higher which is imminent and one bigger retracement for 10w high.
Successive days of heavy selling haven't happened for quite some time and many are assuming a large bounce.
ReplyDeleteIn the next day or two we will know if impulse will be completed or only a-b-c. Accordingly the short term cycles - https://invst.ly/w3eq0
ReplyDeleteI'm curious if you think we could have a 1-2 and now 1-2 of a larger 3 wave.
ReplyDeleteNo, I do not think so.
DeleteTricky extended fifth wave or a-b-c - https://ibb.co/WPNcP3K
Looks like this was another bear trap
ReplyDeleteOr a bull trap.
DeleteKrasi, do you think this is bottom for interest rates for a long time?
ReplyDeleteYes, it is possible, but we have to see the next rally to make conclusions.
DeleteLook at TLT or 10-year yield - clear defined trend lines.
For confirmation the next rally 2022/23 should break the trend line and make higher high like 40-45
Krasi, can you give us the TLT graph?
ReplyDeleteDo you think we are going to end year rally or, too more years rally?
Just open a chart it is pretty obvious - https://schrts.co/svAsWKra
DeleteI expect one more push higher to complete 18m high after that we wait and watch if the trend line is broken or not.
Thanks for your answer
ReplyDeleteOn which trend line you talk about?
The one connecting the lows.....
Delete