Trading trigger - sell signal, close to a low so it is a better idea to wait for the next high if you want to sell.
Analysis - sell the rips, time to get out, potential major top.
P.S. - for a trade both analysis and trigger should point in the same direction.

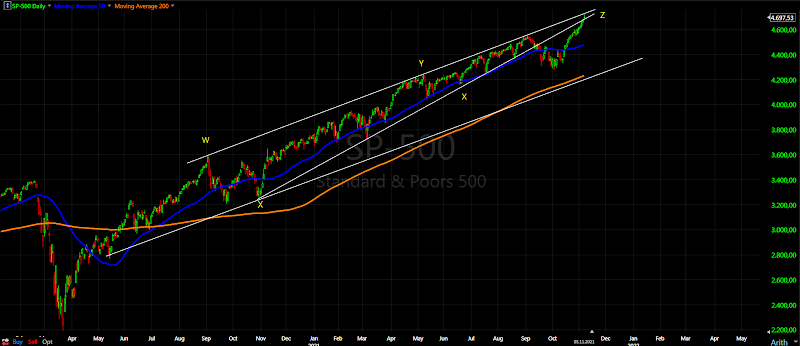
TECHNICAL PICTURE and ELLIOTT WAVES
Short term - waiting for more price action one option is impulse c/Z completed or complex wave b/Z running.

Intermediate term - I see three zig-zags with roughly the same length in time W-x-Y-x-Z or possible W-x-Y with complex double zig-zag for Y. Another reaction after testing the trend lines.... waiting to see how big.

Long term - topping process running for months and maturing. Some kind of corrective wave b-wave and c-wave will follow. MACD and RSI look very "bullish" - multiple divergences.

MARKET BREADTH INDICATORS
Market Breadth Indicators - turned lower, waiting to see just short term top or something more.
McClellan Oscillator - nearing oversold level.
McClellan Summation Index - sell signal.
Weekly Stochastic of the Summation Index - sell signal.
Bullish Percentage - turned lower at 70.
Percent of Stocks above MA50 - turned lower at 75.
Fear Indicator VIX - spike higher, we need higher high to confirm reversal.
Advance-Decline Issues - heading lower, nearing oversold level.
HURST CYCLES
Short term cycles - lower into 20d low as expected. This should be 10w low... the highs look messy next week we should see turn higher for 5w high. Most bullish case another 5 weeks and 10/20/40w high. Most bearish case we saw 4y top.

Week 8 for the 20w cycle. Long term I am expecting 4 year cycle high. The 18m low more likely in late September the case with one extra 20w cycle so that time adjusts for the missing one from last year.