Sep 26, 2020

Weekly preview

Lower as expected... this was the easy part - from the high the short term cycles guided us very well so far, but now comes the difficult part.
Do we have 10w low and what kind of pattern? There is no clear answer to this questions.
EW pattern - corrective waves.... possible diagonal or it is just a corrective leg w-x-y.
Cycles - now it is clear the 20w low was in July so the low this week looks good as 10w low, but if it was late July we can see one more lower low.

The big picture - this decline is too big and too long to be part of the March rally so main scenario is this decline is part of a bigger corrective pattern and we should see a move up soon, but I expect lower high around the elections.


TRADING
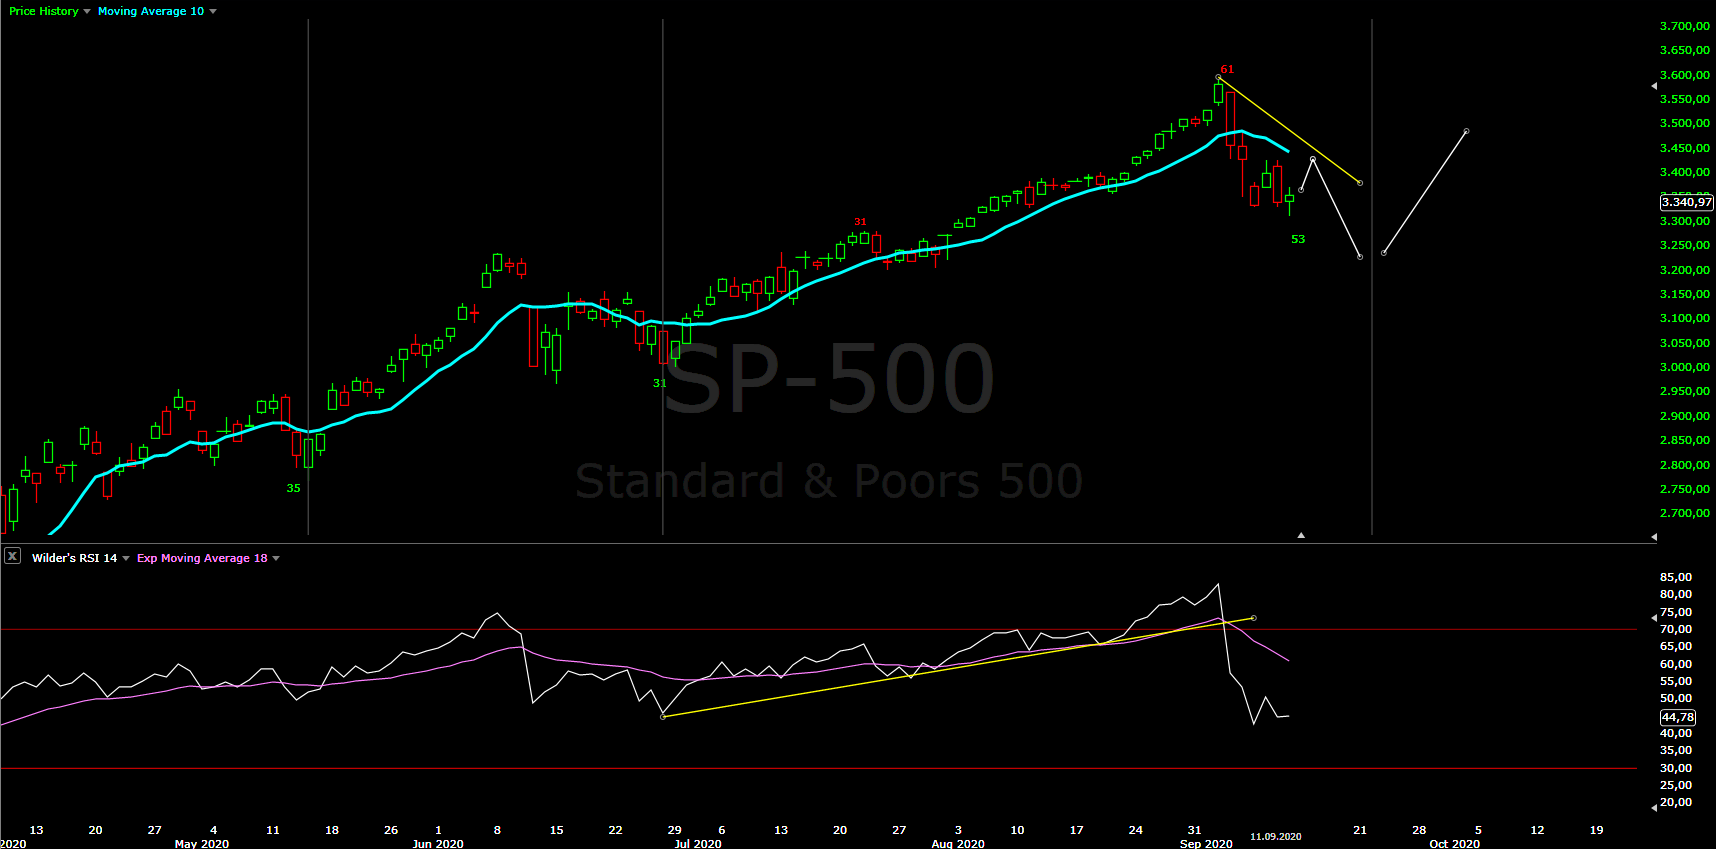
Trading cycle - sell signal. We should see a bottom soon for the third daily cycle and the next one should begin. The trend line hit again:)
Personally I am waiting for the next high - lower or higher high what ever it comes. This corrective waves are only for day trades.


TECHNICAL PICTURE and ELLIOTT WAVES
Short term - one possible pattern is diagonal which you have to construct differently on the cash index and the futures because you have overlap at different places. The futures overlap at the green arrow the cash index a few days later. Not a very good sign... not that the other count is perfect.
To be more precise we have to count double zig-zag w-x-y because we do not have impulses to call simple a-b-c.
Alternate if this is not the low a bigger diagonal like this


Intermediate term - most likely short term low and test of MA50 for 5w cycle high. Alternate we could see one more low, but not much lower slightly above MA200. MACD broke below zero - not a good sign.
Again main scenario we have a top early September and this decline is part of a bigger pattern lower. Waiting for now to see something convincing to put labels.


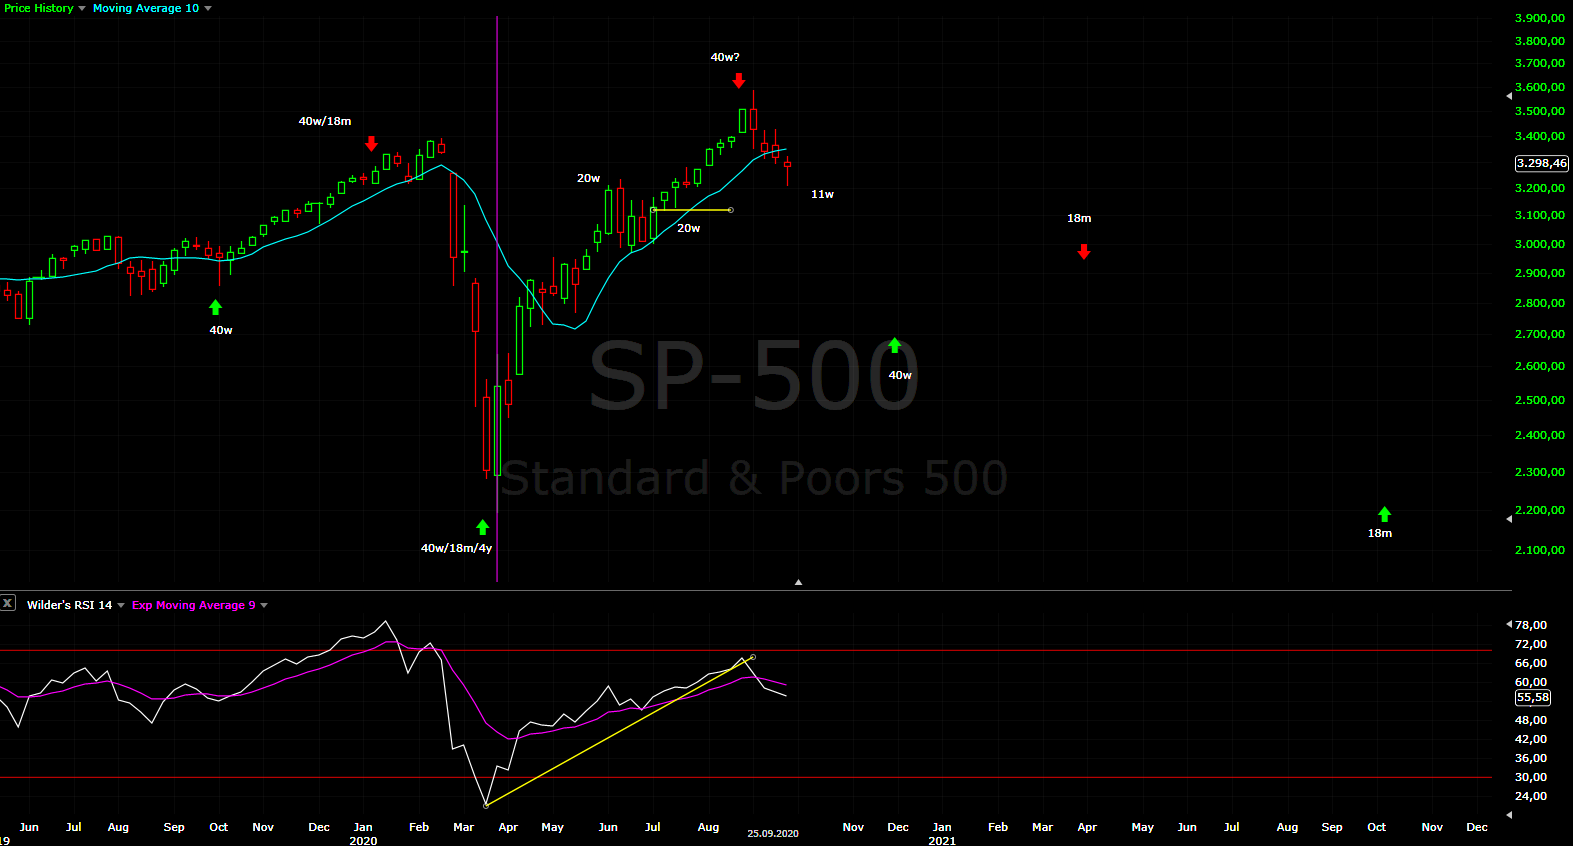
Long term - the bull market completed in 2018. Since then a bunch of corrective waves. Currently I think this rally should be a corrective wave of a bigger pattern flat/triangle or x wave. With corrective waves often you have to adjust so stay open minded.
RSI tested the broken trend line twice and we have a divergence - this has nothing to do with impulse.


MARKET BREADTH INDICATORS
Market Breadth Indicators - sell signals, but signaling it is time to look for a low.
McClellan Oscillator - bounce higher from slightly oversold level.
McClellan Summation Index - sell signal.
Weekly Stochastic of the Summation Index - sell signal, but reached oversold level.
Bullish Percentage - sell signal, but reahed levels where we see a low for a correction.
Percent of Stocks above MA50 - bounced from 25 where corrections usually are completed.
Fear Indicator VIX - doing nothing, most likely test of the previous low is comming before exploding higher.
Advance-Decline Issues - does not show a lot of weakness... we should see something higher.


HURST CYCLES
Short term cycles - lower into the next 20d cycle low, which is most likely 10w low too. Next we should see 3-5 days higher for 20d/5w high.
Alternate scenario one more low possible if the 20w low was late July.


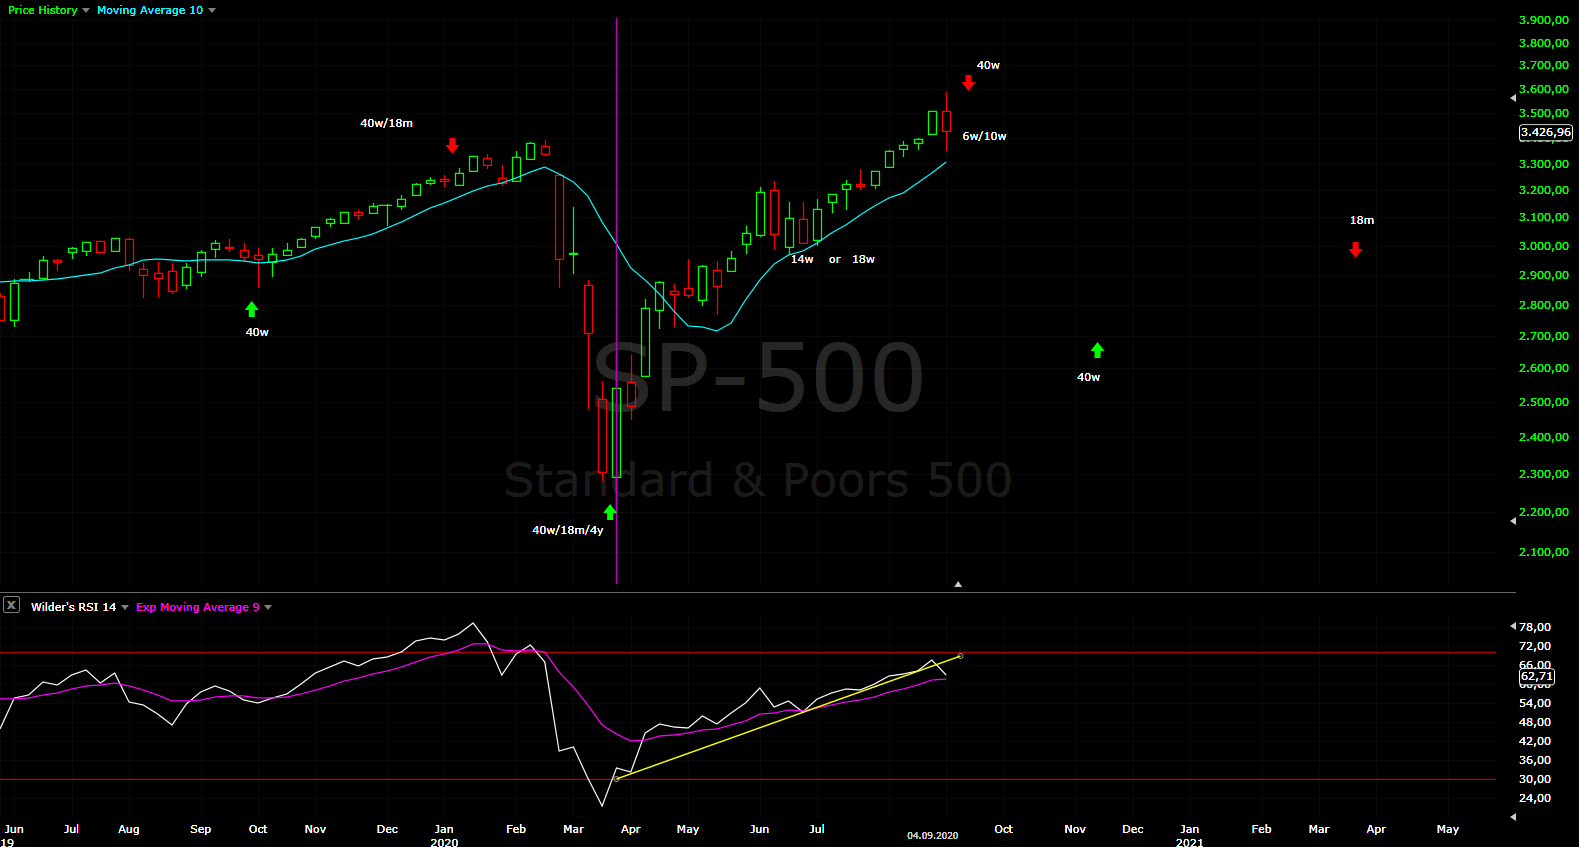
Week 11 for the 20w cycle. Now it looks official that the 20w low is not in June, but rather in July. 20w cycle with length 14 weeks followed by 10w cycle with length 13 weeks does not make much sense. For now sticking to the scenario with a low first half of July, but if we see one more low in the next 1-2 weeks than the 20w low was the second half of July.
The price and RSI are now below their MAs, which means 20w cycle turned lower. Very unlikely to be the first one from March with length 27 weeks, which means it is the second one declining, which means we have 40w high in September and decline into 40w low is running.

Sep 19, 2020

Weekly preview

Sideways correction to complete 20d cycle high as expected. Next we should see move lower lasting another 5-6 trading days for intermediate term low.


TRADING
Trading cycle - still sell signal. Perfect hit of the trend line(I did not toucht it, I swear:) In a week or so this third daily cycle should be completed and we should see a bottom.... according to my cycle phasing.


TECHNICAL PICTURE and ELLIOTT WAVES
Short term - sideways correction, which looks like a flat. The pattern does not look like a bottom so we should see some kind of c wave lower... I doubt we have an impulse.


Intermediate term - MA50 was a support. SPX had the chance to bounce three times, but now it closed below it - this is not very bullish. Most likely the price will continue lower. MACD is starting to break below zero which is not good.
The cash index has target c=a around 3170 and the futures around 3120. Maybe the break below MA50 is a hint that MA200 will be tested.


Long term - I think the bull market completed in 2018. Since then a bunch of corrective waves. Currently I think this rally should be a corrective wave of a bigger pattern flat/triangle or x wave. With corrective waves often you have to adjust so stay open minded.
RSI tested the broken trend line creating a divergence nice short setup.


MARKET BREADTH INDICATORS
Market Breadth Indicators - nothing new correction is running and sell signals.
McClellan Oscillator - reseted from sligthly oversold level and turned lower again.
McClellan Summation Index - sell signal.
Weekly Stochastic of the Summation Index - sell signal, oversold level reached.
Bullish Percentage - sell signal.
Percent of Stocks above MA50 - pointing lower in the middle of the range.
Fear Indicator VIX - we should see a spike and cool off again.
Advance-Decline Issues - in the middle of the range after divergence and breaking the trend line.


HURST CYCLES
Short term cycles - we have the expected 20d high with length 10 days. Next we should see a decline for about a week for the next 20d cycle low, which should be 10w low. Cycle with the same length point to a low on 28th of September.


Week 10 for the 20 week cycle. I thought 3x10w for 40 week cycle is anomaly, but look at Q4/2018-Q1/2019 the same thing. I would say the reason is the speed - when the price moves too fast the cycles are shorter. Remember the down phase of this 40w high is 20w cycle lasting only 7 weeks(the biggest cycle anomaly I have seen). I would say it is perfectly fine if we saw the 40w high already.

Sep 12, 2020

Weekly preview

Some selling, which is not a surprise, but messy pattern and no confirmation for reversal so far. I think the alternate patterns 4/X are dead and now there is a battle around the MAs:) the first dips will be bought - this is how topping works.

Waiting for further price action to confirm or not reversal. In both cases expect something bigger to the downside after another higher or lower high around the elections in the USA.

Glenn Neely - "War Of The Waves" the game is afoot:)
First we have to say the most EW guys have no clue what they are talking about. There is one orthodox EW guy I know counting corrective pattern from 2000(from 2009 is B wave) Peter Temple, but he sees the end of the world DJ from 30k to 3k mega wave c/4 in 2-3 years...
With so many corrective waves in the last few years I will not be surprised if Neely is rigth. This is not how major top and reversal looks like.


TRADING
Trading cycle - sell signal, the declining phase of the third daily cycle is running. It should not last very long, we have rigth translated cycle and 10w low is expected in the next 2 weeks.


TECHNICAL PICTURE and ELLIOTT WAVES
Short term - messy pattern, more price action is needed to make some conclusions. For now it looks like leg lower a/1 and sideways correction b/2. The decline does not look completed. The only way I see to construct impulse somehow is diagonal in white on the chart.


Intermediate term - so far finding support at MA50 as expected. Waiting to see confirmation or not for reversal. If Y is not completed probably more complex Y and this is b/Y


Long term - I think the bull market completed in 2018. Since then a bunch of corrective waves. Currently I think this rally should be a corrective wave of a bigger pattern flat/triangle or x wave. With corrective waves often you have to adjust so stay open minded.
Two weeks in a row selling this happens for the first time since March and the indicators are showing that something is going on. Topping and transition into the down phase of the 40w cycle has begun.


MARKET BREADTH INDICATORS
Market Breadth Indicators - pointing lower in sell mode.
McClellan Oscillator - below zero.
McClellan Summation Index - sell signal.
Weekly Stochastic of the Summation Index - sell signal.
Bullish Percentage - sell signal.
Percent of Stocks above MA50 - sell signal, in the middle of the range.
Fear Indicator VIX - cooling off as expected.
Advance-Decline Issues - the trend line connecting the lows has been broken and tested now we should see something lower.


HURST CYCLES
Short term cycles - this week should be 20d low as expected. Next week we should see a bounce higher for 20d high.

More about this tricky 20w low - I would say SP500 is the wrong place to watch for it. DJ shows more clearly the idea which I mentioned weeks ago low in mid July. I think the pattern low is on 10th of July trinagle X wave(important cycle lows are at pattern lows), you have 4x20d cycles instead of 3 nothing missing and 20w cycle with length 16 weeks consisting of two symetrical 10w cycles. This is waaaay better than counting a low end of June, which has none of this.
SP500 is wannabe NDX, but it is just a distorted version of DJ/NYSE. Even the NDX has a clear low on 24th of July for 20w cycle with length 18 weeks so a low in June is not very likely.


Week 9 for the second 20 cycle. The 40w high - something is going on RSI is breaking below the MA, but the price is still finding support at MA10. On the other side the sequence is 20w high - 20w low - 10w high(not 20w/40w) - 10w low, which means the 40w high is in two months. So still waiting for confirmation or not for a 40w high, which could be impulse lower or move below the previous 20w low.


Tom Demark SEQUENTIAL AND COUNTDOWN - this technique spots areas of exhaustion.
Continue to work like a clock for three weeks in a row - setup completed last week and now we have the price flip.

Sep 5, 2020

Weekly preview

The market never makes it easy - we saw w4 as long sideways move and w5 as expected to complete a pattern and then big decline, which is not an impulse so far.

From EW perspective - either the decline continues or if it is completed as a zig-zag than it should be w4 from a bigger impulse or another X wave.
Simple TA perspective - look at RSI and MA50 the price does not crash with this setup(strong RSI and well above MA50). If you compare the indicators with Jan-Feb we saw the January high and declne so we should see a second high... higher or lower high is another story.
The trading cycle - we have strong right translated cycle and the high should be tested... lower or higher high what ever.

My conclusion - patience, let the pattern play out and for trading we will have our low risk setup later with a second high. With that said do not get fooled this move from March is completing, the time to take profits is already running. It has begun with the blow off on Wednesday and it will contine with this second high.
To clarify the move lower I expect should be long and corrective nothing to do with the March decline. The EW theory says the waves alternate in time and complexity so do not expect the same outcome.


TRADING
Trading cycle - we have clear sell signal with huge red bar closing below MA10 and RSI clear break lower. Now it is waiting for the current cycle to make a low and for the next one to make a high. The next cycle should be weak and left translated.


TECHNICAL PICTURE and ELLIOTT WAVES
Short term - my primary scenario is completed w-x-y(red). For confirmation we need impulse lower, which we do not have for the moment.
Until then alternate patterns are possible like w4 of a bigger impulse C(white) or another X wave.


Intermediate term - clear MACD divergence, RSI broke the trend line so best case one more high with divergence. On the other side RSI moving too fast too vertical close to 50 already so worst case test of the high to establish new down sloping trend line. Look at how in January MA50 was tested -> bounce -> divergence and then lower. We should see something simmilar with ot without higher high.
I am sticking to my primary count W-X-Y. I do not like how this supposed waves X or 4(which is lower degree subwave) are braking the base channel - this is no go.


Long term - I think the bull market completed in 2018. Since then a bunch of corrective waves. Currently I think this rally should be a corrective wave of a bigger pattern flat/triangle or x wave. With corrective waves often you have to adjust so stay open minded.
The odds are shifting into favor of Neely's pattern - triangle. For NDX this leg is bigger than 161% compared to the previous one so X or b flat is not working, what left is b wave of a triangle.... and I do not think SP500 and NDX have different patterns.


MARKET BREADTH INDICATORS
Market Breadth Indicators - weak pointing lower with divergences for a very long time so nothing new.
McClellan Oscillator - below zero.
McClellan Summation Index - sell signal and divergence.
Weekly Stochastic of the Summation Index - sell signal and divergence.
Bullish Percentage - sell signal with divergences.
Percent of Stocks above MA50 - turned lower below 75 with divergence.
Fear Indicator VIX - spike higher, cool off should follow and higher again.
Advance-Decline Issues - broke the trend line connecting the lows and now testing it, the next move up will be the top or we already saw it.


HURST CYCLES
Short term cycles - it looks like we are close to the next 20d low. The two posible 20w lows accordingly this should be 5w or 10w low.


Week 6 or 10 for the 20w cycle. For now I follow both counts and watch the further price action. We are close to 40w cycle high or we saw it this week.


Tom Demark SEQUENTIAL AND COUNTDOWN - this technique spots areas of exhaustion.
Setup completed on the weekly chart price flip is close below 3372.