Trading cycle - we have clear sell signal with huge red bar closing below MA10 and RSI clear break lower. Now it is waiting for the current cycle to make a low and for the next one to make a high. The next cycle should be weak and left translated.

TECHNICAL PICTURE and ELLIOTT WAVES
Short term - my primary scenario is completed w-x-y(red). For confirmation we need impulse lower, which we do not have for the moment.
Until then alternate patterns are possible like w4 of a bigger impulse C(white) or another X wave.

Intermediate term - clear MACD divergence, RSI broke the trend line so best case one more high with divergence. On the other side RSI moving too fast too vertical close to 50 already so worst case test of the high to establish new down sloping trend line. Look at how in January MA50 was tested -> bounce -> divergence and then lower. We should see something simmilar with ot without higher high.
I am sticking to my primary count W-X-Y. I do not like how this supposed waves X or 4(which is lower degree subwave) are braking the base channel - this is no go.

Long term - I think the bull market completed in 2018. Since then a bunch of corrective waves. Currently I think this rally should be a corrective wave of a bigger pattern flat/triangle or x wave. With corrective waves often you have to adjust so stay open minded.
The odds are shifting into favor of Neely's pattern - triangle. For NDX this leg is bigger than 161% compared to the previous one so X or b flat is not working, what left is b wave of a triangle.... and I do not think SP500 and NDX have different patterns.

MARKET BREADTH INDICATORS
Market Breadth Indicators - weak pointing lower with divergences for a very long time so nothing new.
McClellan Oscillator - below zero.
McClellan Summation Index - sell signal and divergence.
Weekly Stochastic of the Summation Index - sell signal and divergence.
Bullish Percentage - sell signal with divergences.
Percent of Stocks above MA50 - turned lower below 75 with divergence.
Fear Indicator VIX - spike higher, cool off should follow and higher again.
Advance-Decline Issues - broke the trend line connecting the lows and now testing it, the next move up will be the top or we already saw it.
HURST CYCLES
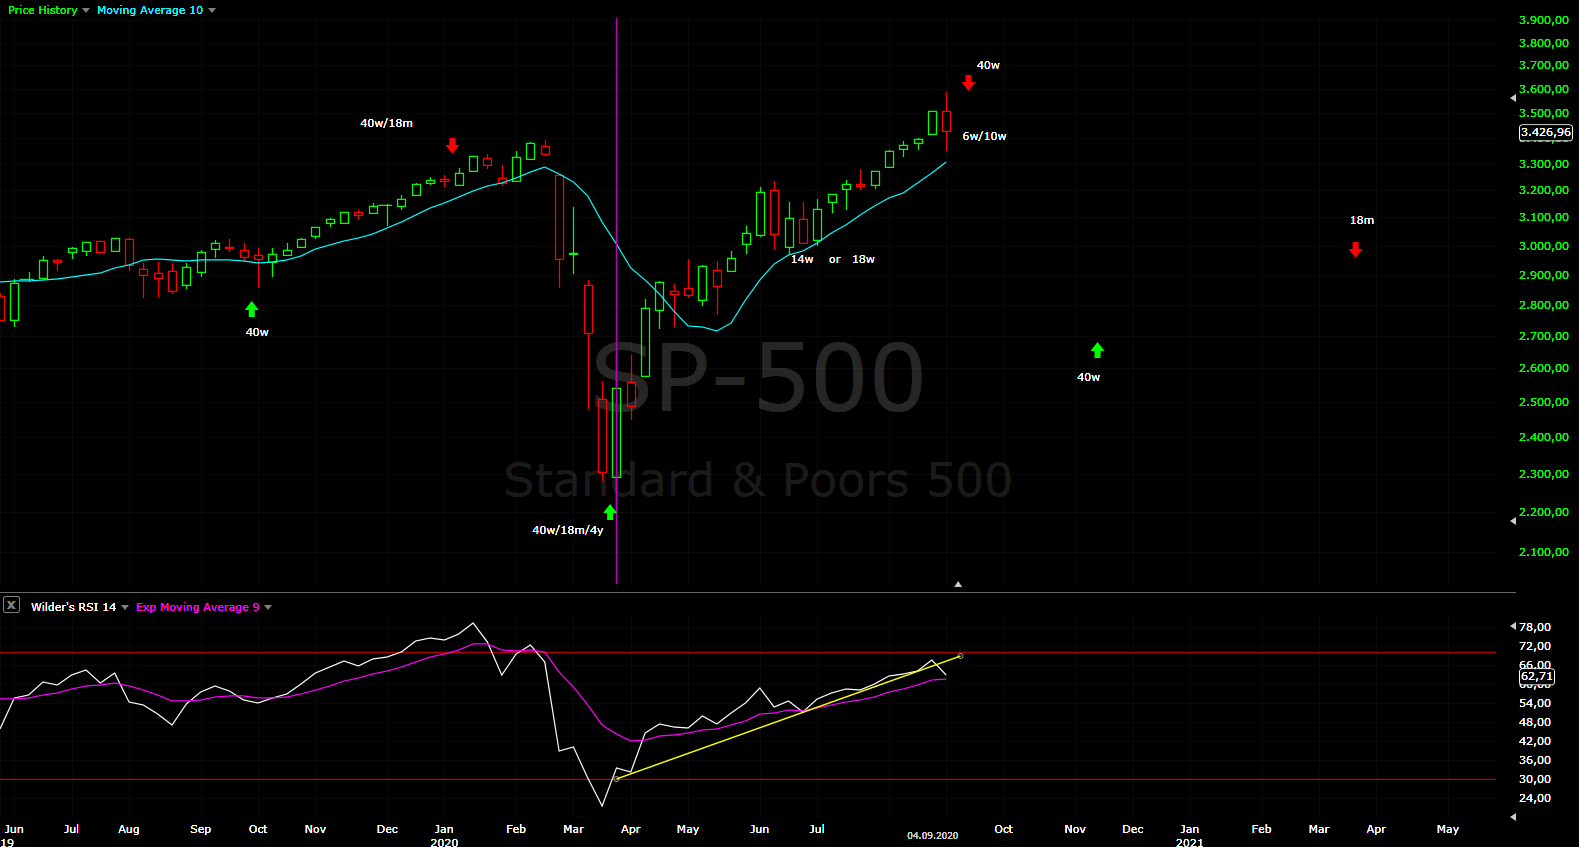
Short term cycles - it looks like we are close to the next 20d low. The two posible 20w lows accordingly this should be 5w or 10w low.

Week 6 or 10 for the 20w cycle. For now I follow both counts and watch the further price action. We are close to 40w cycle high or we saw it this week.
Tom Demark SEQUENTIAL AND COUNTDOWN - this technique spots areas of exhaustion.
Setup completed on the weekly chart price flip is close below 3372.

https://bolsayciclos.wordpress.com/
ReplyDeleteOne sign the rally isn't done is that CV stocks haven't been rallying yet with this latest VIX spike like back in Jan and Feb.
ReplyDeleteThe European indices EU50,DAX30,CAC40 with w-x-y(triangle) pattern so lower high - https://invst.ly/s13qs
ReplyDeleteKrasi,
DeleteWhat do you think about the /CL futures?
It looks incredibly bearish to me. Your thoughts always appreciated.
- Kali
CL broke lower from the wedge with impulse so decline into 40w cycle low has begun... I guess 8-10 weeks lower.
Deletehttps://analisisbolsa.com/la-gran-caida-tiene-senales-claras-pero-sin-confirmar/
ReplyDeleteGold, silver, oil?
ReplyDelete"CL" above is oil.
DeleteGold/Silver probably a triangle running, oil see above.
DeleteHi Krasi, SPX looks like double bottom and divergence building up. Do you think it is ready to reverse?
ReplyDeleteNo, minimum one more leg for double zig-zag or it is a diagonal.
Deletethey gonna sell the close and then buy it overnight. smart f#uckers. CNBC promoting the fire exits
ReplyDeleteThe market plunges, and the VIX drops???
ReplyDeleteWhy is uvxy acting weird? It should be at minimum $32 now.... anyone have a target price for uvxy?
ReplyDeleteThanks
Contango
DeleteBS Louis, vix term structure was in backwardartion as you would expect in vol spike. The reason vix futures sold of (and vxx consists of 1st and 2nd vix future) is that big option dealers (institutions that write options) sold their vol hedges. As you may know, the blow off in tech stock was driven by call option buying. Dealers writing callocall have to hedge by doing two things, buy underlying stock and buy volatility protection (usually vol for a broad index like s&p vix futures) in case their underlying stock for option their wrote cannot be sold at breakeven price.
DeleteHere you can see vix term structure
Deletehttp://vixcentral.com/
Vxx is now mostly composed of October futures
And contango is the reason why vix future based etn products loose value over long period of time when there is no volatility, because you have to constantly roll contracts that loose value. Same principle applies to any other asset class where there is futures curve, i.e oil or natgas
DeleteOne more thing, option dealers sold their hedges because they knew the gamma whale SoftBank closed their 7billion call option position, see zerohedge for details
DeleteI am not volatility expert, I would say the same trade which caused VIX to move higher with the index is getting unwind and now we see it in reverse. Zerohedge wrote a few times about that speculation with options hedging etc.
ReplyDeleteA leg almost done?
ReplyDeleteYesterday 10w low?
ReplyDeleteI doubt it, I think the 20w low was in July.
DeleteDollar may reverse here, could be a bad day for longs/gold https://imgur.com/gallery/116axky
ReplyDeletelooks like market will reverse and dollar will make another low. Krasi are we starting C for the SPX do you think?
DeleteShort term yes, long term there is no impulses in both directions.
DeleteAh ok I thought we had an impulse down. Thanks
DeleteKrasi, Can the gold triangle be "B" instead of 4? If So, C will be a nice move down (maybe today?) https://imgur.com/gallery/E8tC0ln
ReplyDeleteYes, it looks better like triangle for continuation lower.
Deleteexcellent thank you
DeleteHi Krasi, what is your short term forecast for SPX? Possible to post a chart? You had mentioned one more leg lower which looks like happened. Based on 1hr RSI, it looks like SPX and major stocks are ready to reverse for the short term
ReplyDeleteThe pattern is not very clear, but it does not look complete I would say there is more to the downside.
DeleteIt looks like leg lower, sideways move and one more leg lower to follow. We are seeing sideways correction instead of reversal higher.
Thank you!
DeleteNQ head and shoulders? everyone is expecting a bounce but what if it just drops?....hmmm https://invst.ly/s3ndd
ReplyDeleteBecause of cycles I think it is time for a bounce.
Delete