Trading cycle - sell signal, the declining phase of the third daily cycle is running. It should not last very long, we have rigth translated cycle and 10w low is expected in the next 2 weeks.
TECHNICAL PICTURE and ELLIOTT WAVES
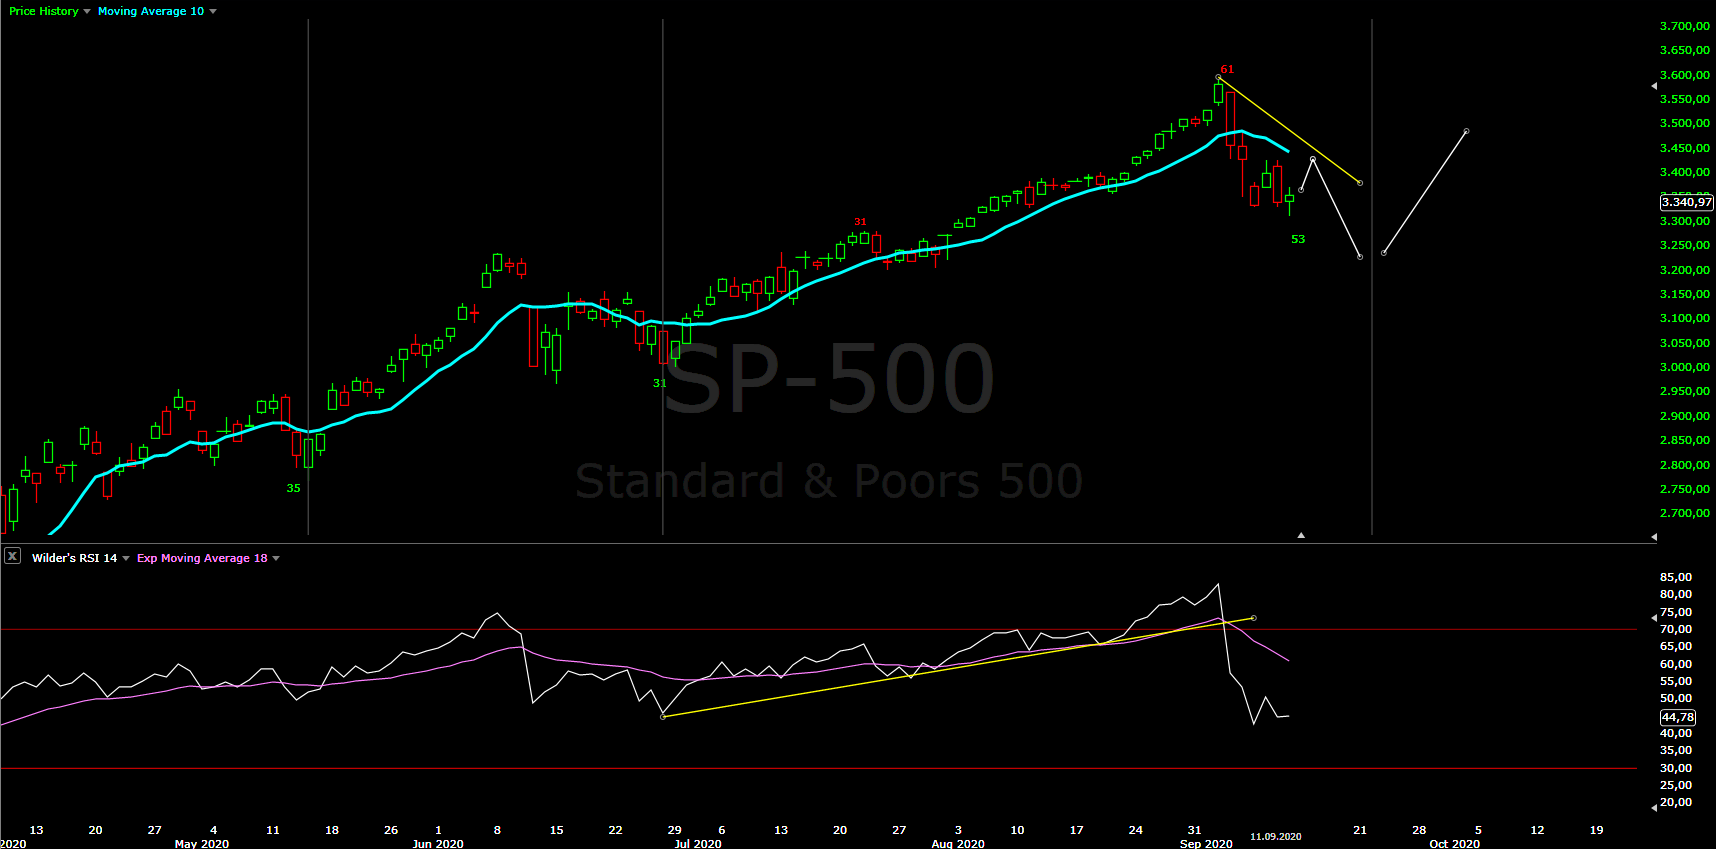
Short term - messy pattern, more price action is needed to make some conclusions. For now it looks like leg lower a/1 and sideways correction b/2. The decline does not look completed. The only way I see to construct impulse somehow is diagonal in white on the chart.

Intermediate term - so far finding support at MA50 as expected. Waiting to see confirmation or not for reversal. If Y is not completed probably more complex Y and this is b/Y

Long term - I think the bull market completed in 2018. Since then a bunch of corrective waves. Currently I think this rally should be a corrective wave of a bigger pattern flat/triangle or x wave. With corrective waves often you have to adjust so stay open minded.
Two weeks in a row selling this happens for the first time since March and the indicators are showing that something is going on. Topping and transition into the down phase of the 40w cycle has begun.

MARKET BREADTH INDICATORS
Market Breadth Indicators - pointing lower in sell mode.
McClellan Oscillator - below zero.
McClellan Summation Index - sell signal.
Weekly Stochastic of the Summation Index - sell signal.
Bullish Percentage - sell signal.
Percent of Stocks above MA50 - sell signal, in the middle of the range.
Fear Indicator VIX - cooling off as expected.
Advance-Decline Issues - the trend line connecting the lows has been broken and tested now we should see something lower.
HURST CYCLES
Short term cycles - this week should be 20d low as expected. Next week we should see a bounce higher for 20d high.
More about this tricky 20w low - I would say SP500 is the wrong place to watch for it. DJ shows more clearly the idea which I mentioned weeks ago low in mid July. I think the pattern low is on 10th of July trinagle X wave(important cycle lows are at pattern lows), you have 4x20d cycles instead of 3 nothing missing and 20w cycle with length 16 weeks consisting of two symetrical 10w cycles. This is waaaay better than counting a low end of June, which has none of this.
SP500 is wannabe NDX, but it is just a distorted version of DJ/NYSE. Even the NDX has a clear low on 24th of July for 20w cycle with length 18 weeks so a low in June is not very likely.

Week 9 for the second 20 cycle. The 40w high - something is going on RSI is breaking below the MA, but the price is still finding support at MA10. On the other side the sequence is 20w high - 20w low - 10w high(not 20w/40w) - 10w low, which means the 40w high is in two months. So still waiting for confirmation or not for a 40w high, which could be impulse lower or move below the previous 20w low.

Tom Demark SEQUENTIAL AND COUNTDOWN - this technique spots areas of exhaustion.
Continue to work like a clock for three weeks in a row - setup completed last week and now we have the price flip.

Hello Krasi,do you think Oil could go down to 29/30 $ ?
ReplyDeleteYes, this is the first support level.
DeleteThank you for your analysis. Up top you say to expect a high around the US elections. In your 2nd to the last graph you indicate a 40 week low around the same time. Why the discrepancy? Thank you
ReplyDeleteThis low is in the first half of December not well visible on the chart.
DeleteKrasi,
ReplyDeleteYou say the price action has not confirmed a reversal yet. But if you look at Nasdaq, the price has clearly reversed. It has broken the 10 week moving average to the downside this week. Isn't that a confirmation of move lower?
I guess I am trying to understand which criteria you are looking for.
Also looking at your forecast, I wonder what would the new pattern be if we move lower instead of retracing higher? I think majority of traders are looking for a move higher based on the double bottom. Surprise move lower would cause some panic selling.
- Kali
I want to see impulse lower for confirmation. If we see continuation lower is a/1-b/2-c/3
DeleteIn the next 1-2 weeks we should see 10w low so next is 10w high. One or another way we should see another high.
DJIA and IWM both have not filled their gaps, I'm wondering if the SPY bounce will be outperformed on those indexes? DJIA doesn't even have daily divergence yet.
ReplyDeleteI do not pay so much attention to gaps, by the way DJI filled it.
Deleteoh yes you are right, IWM didn't fill it's gap. IWM looks like another possible ABC to me :(
Delete8 june 20w high and 2 september 10w high?
ReplyDeleteThis should be the right sequence as mentioned above....
DeleteAlthough in Q42018/Q12019 we have the same "anomaly" 40w cycle with 3x10w.
DeleteThe price action looks the same V so 2 September could be 20w/40w high.
I am not making any conclusions for now.
For me November will be 40 high and december 40 low in terrorific wave C to 2300-2500
DeleteHi Krasi.
ReplyDeleteIm Keith eFollen.
God job!
How far do you think Amazon can go?
ReplyDelete-Mary A. Unpajote
Thanks!
Retracing all the gains from this year.
DeletePlease Krasi, one long term Elliott recount of Bitcoin.
ReplyDelete-Jhonny Melapelo.
Not sure about the EW count, but timing looks interesting exactly like the stock indices - low in 2021 and high in 2022. After that we should see big decline.
DeleteGreat job Krasi!
ReplyDeleteThe very best Elliott trader!
The USA Index go to other all time high?
ReplyDeleteThumama Melamama, from South África.
I doubt it, but confirmation is still needed.
DeleteNext week will be 5 w high?
ReplyDeleteThis week should be 20d high and in another two weeks the 5w high.
Deletethere is another option: 2 september 5w high and 12 september 5w low
DeleteIm interested on silver.
ReplyDeleteWhats your think about?
Chu, Pamela Chu... Pamela Chu, Pamela Chu...
Taiwan
I would say one final higher high to complete the pattern and important 8 year cycle high.
DeleteKrasi "el maño".
ReplyDeleteIs possible S&P go to 4000 Krasi?
ReplyDeleteBefore the 40w low around the end of this year not very likely....
DeleteLooks like a V shaped recovery for tech stocks again. :-)
ReplyDeleteI think you need glasses....
DeleteNDX 3 days decline followed by 5 days corrective move which retraced so far less than 38% - how is this V shape recovery!?!?!?
What do you think of the dollar here? Retrace to 96 then lower? Or another set of impulses to shock everyone
ReplyDeleteI would say higher, but probably just 4 or b/Y.
Deletecan anyone comment on UVXY estimated target price in the next few weeks?
ReplyDeleteThanks
My opinion between 30-35 in the next 2 weeks. It depends on how fast the leg lower for the indices will be. After that lower for 4-5 weeks.
DeleteUVXY 19.3 double bottom?
ReplyDeleteYes, it looks like double bottom.
DeleteLooks like we start getting the Krasi upmove today
ReplyDeleteEther the red one b/2 is complete as a flat, but the c of the flat is not very convincing so the pattern could be triangle with one more wave e.
Delete1 more upmove in spx 3450
ReplyDeleteThen pow
More likely just closing the gap below 3400 to complete a triangle and then pow.
DeleteIn thinking 3450 then 3200 then 3600
Deleteqqq daily still looks like a big fat head and shoulders
ReplyDeleteKrasi, I think the Indexes go Up to new historic récord.
ReplyDeleteWhat is this statement based on?
DeleteI think the indices will not go to new historic record.
Hi Krasi, any guess on how much more downside before SPX heads higher? On larger time frames, RSI is looking weak but on smaller time frames, it looks like it is close to bottom, may be after hitting gap close to 3279.
ReplyDeleteSee the new post there is target for time and price.
Delete