Jul 25, 2020

Weekly preview

It took a lot of time to see completed pattern from the late June low, but finally this week we have it - zig-zag. There is impulse lower on shorter time frames with divergences - the indicators on the daily chart and market breadth. This should develop as wave c of expanded flat and 20w low in a few weeks - this is the most obvious and main scenario.
Alternate the move from the March low is completed and we had 20w low late June - this is speculation and can not be confirmed at the moment. This b wave lasted very long, longer than the previous rally from mid May and you have to count three daily cycles for one 20w cycle, which is suspicious.


TRADING
Trading cycle - sell signal was triggered. Just slightly below MA10 for the moment, most likely after retracement on Monday we will see convincing red bar below MA10.
It seems the daily cycle is running shorter, if it continue this way the low should be in 2,5-3 weeks. Cycle with normal length like 45 days will shift the odds that the alternate scenario is playing out.


TECHNICAL PICTURE and ELLIOTT WAVES
Short term - on Thursday we saw slightly higher high to complete impulse for (c)/b and zig-zag from the 29.June low. Now we have completed pattern and wave c should be running. Two possible targets for expanded flat wave c are shown 138% and 161% extension. The indicators MACD/RSI broke the trend line lower after divergences confirming move lower should be running.
The alternate pattern is in red - wave Z


Intermediate term - divergences on all indicators, we should see sell off. The 1,618 extension for wave c of expanded flat is perfect hit of the 38% retracement so it looks interesting as a target for the decline.


Long term - I think the bull market completed in 2018. Since then a bunch of corrective waves. Currently watching this pattern... but with corrective waves often you have to adjust so stay open minded.


MARKET BREADTH INDICATORS
Market Breadth Indicators - turning lower with divergences, which is usually a sign for a top.
McClellan Oscillator - below zero.
McClellan Summation Index - divergence.
Weekly Stochastic of the Summation Index - sell signal.
Bullish Percentage - turned lower, divergence.
Percent of Stocks above MA50 - turned lower, divergence.
Fear Indicator VIX - double bottom, we should see spike higher.
Advance-Decline Issues - turned lower, divergence.
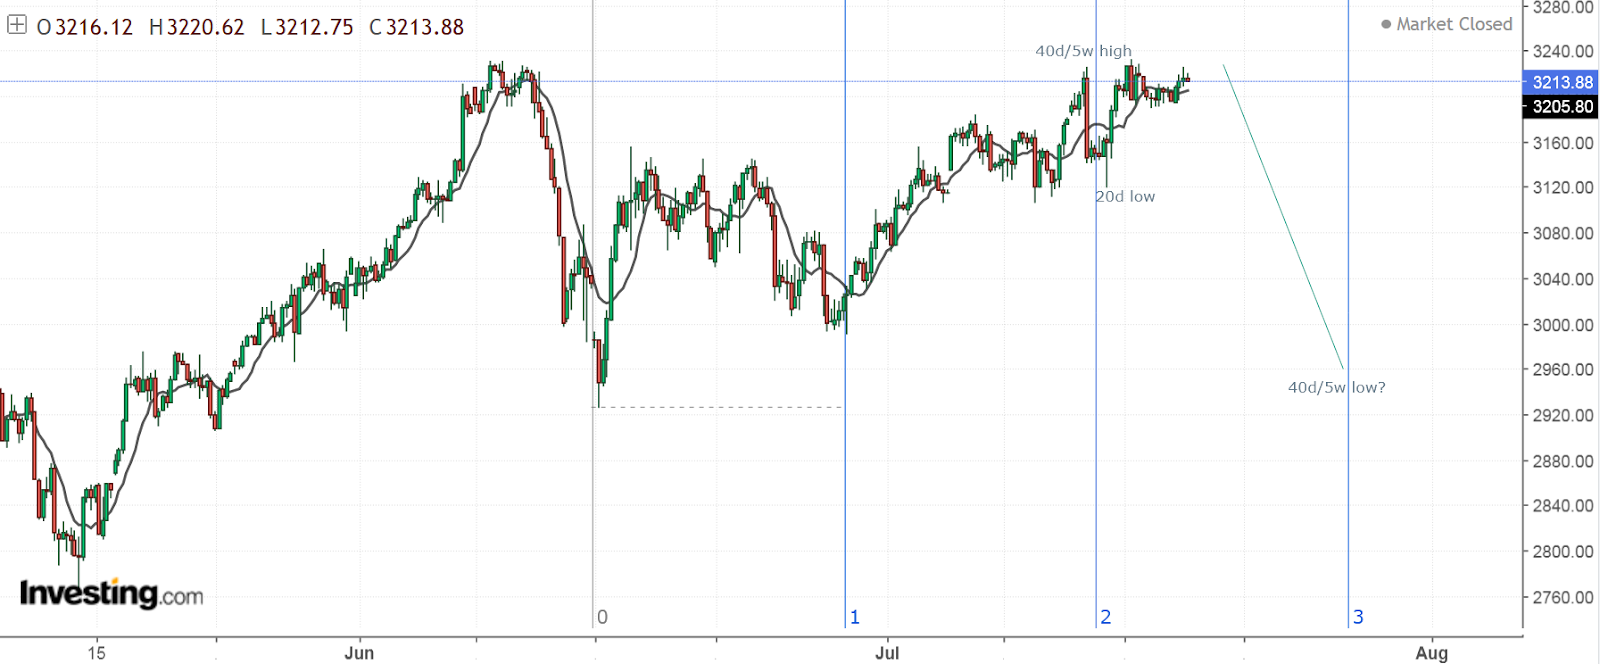

HURST CYCLES
Short term cycles - it looks like 20d low on Monday and now the 40d cycle turning lower.


Week 18 for the 20w cycle. We should see a decline for 2-3 weeks to complete the cycle. Alternate late June was 20w cycle low and we are seeing M pattern aka double top similar to Jan-Feb.

Jul 18, 2020

Weekly preview

Strange week one push higher as expected sharp reversal and back to the high staying there for three days in narrow range. In the mean time the weaker indices rallied strong to catch up and now other indices like NYSE,RUT,DJ even EUR/USD are synchronized and from the June high have the same pattern like SP500.

It is taking a lot of time, but from pattern and time perspective still the most likely outcome is wave c lower for a flat and 20w cycle low. If not we have to speculate with another corrective wave z higher or 20w low late June.


TRADING
Trading cycle - the trigger is still on buy, but again I do not see a support for a buy from the other tools neither market breadth nor cycles nor EW says buy.
This daily cycle is much weaker compared to the previous two - strong 3/4 weeks higher and 3/4 weeks correction now we have 3 weeks higher and it is just testing the previous high.
As usual wait for close below MA10 to confirm reversal lower.


TECHNICAL PICTURE and ELLIOTT WAVES
Short term - very difficult to say what the last three days are... there is no impulse higher and there is no impulse lower to confirm reversal. Best guess ED to complete the pattern.
With the price action this week I do not think we have one mega complex b wave rather two complex waves a-b(white labels) from a flat. So synchronized the SP500 count with the other indices, I think now they all have the same pattern. This does not change the big picture, still expecting c wave lower.
The green count is speculation if we see continuation higher.


Intermediate term - SP500 made slightly higher high so theoretically we have divergences. Now expecting c wave lower.


Long term - I think the bull market completed in 2018. Since then a bunch of corrective waves. Currently watching this pattern... but with corrective waves often you have to adjust so stay open minded.


MARKET BREADTH INDICATORS
Market Breadth Indicators - sell signals and SP500 made slightly higher high so theoretically we have divergences.
McClellan Oscillator - above zero.
McClellan Summation Index - sell signal.
Weekly Stochastic of the Summation Index - sell signal.
Bullish Percentage - lower high, below 70.
Percent of Stocks above MA50 - lower high divergence.
Fear Indicator VIX - higher lows, I expect spike higher.
Advance-Decline Issues - weak, crawling slowly higher.


HURST CYCLES
Short term cycles - the sharp moves up and down probably caused by 5w high followed by 20d low and now the next 20d cycle rising and making M pattern aka double top. If this is the case next week we should see turn lower for 5w cycle low to complete the 20w cycle.


Week 17 for the 20w cycle. The time is ripe for a decline for 2-3 weeks to complete the cycle. Alternate late June was 20w cycle low and we are seeing M pattern similar to Jan-Feb.

Jul 11, 2020

Weekly preview

Choppy week with zig-zag lower and zig-zag higher so far. For the weaker indices DI,NYSE,RUT the pattern continue to look like triangle for SP500 like the yellow pattern from the hourly chart last week.... all this heading into 5w cycle high some counting it as 20w high. It could squeeze another 1-2 days higher, but time and pattern look mature for a turn lower.


TRADING
Trading cycle - the trigger is on buy. The price tested MA10 making 10d cycle low and RSI tested the MA. Most likely we have completed daily cycle with length 31 trading days. Now the next one running at day 9 - it looks weak so far I expect to fail as left translated and it will decline for the final leg of the correction and for a few weeks to complete the 20w cycle.
Alternate we have 20w cycle low late June... because usually the 20w cycle consist of two such daily cycles.


TECHNICAL PICTURE and ELLIOTT WAVES
Short term - I am watching a-b-c pattern with complex b wave as w-x-y. If we see the move higher continue longer than another 1-2 days or higher around 2300 this is in fact bearish and it is most likely Z wave the red count.


Intermediate term - expecting c wave to complete correction. Lower target for the decline at least to 38% retracement and closing the gap makes more sense. Again if you are bullish you do not want to see continuation higher the red path. This will mean the move from the March low is complete and it will decline until November.


Long term - currently I think the bull market completed in 2018. Since then a bunch of corrective waves. Watching this pattern at the moment as most likely... but with corrective waves often you have to adjust so stay open minded.
Because of the NDX I added this "or X" if we do not see correction it will not make it higher until October. We will see a top now.


MARKET BREADTH INDICATORS
Market Breadth Indicators - are in sell mode.
McClellan Oscillator - below zero.
McClellan Summation Index - sell signal.
Weekly Stochastic of the Summation Index - sell signal.
Bullish Percentage - turned lower.
Percent of Stocks above MA50 - up and down in the middle of the range.
Fear Indicator VIX - time for the next spike?
Advance-Decline Issues - in the middle of the range.


HURST CYCLES
Short term cycles - I think we had 10d low this week and now heading into 40d/5w cycle high. After that the indices should turn lower for 5w cycle low to complete the 20w cycle.


Week 16 for the 20w cycle. We should see decline for 2-3 weeks to complete the cycle. Alternate we have 20w cycle low late June... this will be very bearish development.

Jul 4, 2020

Weekly preview

The last minor high tested instead of acceleration lower - not a big surprise. The indices look different - NDX making new highs looks like ED, SP500 sideways move looks like flat, the others like DJI,NYSE,RUT look weak maybe triangle.

Short term momentum turned up and my system is on buy so until I see reversal with impulse I can not exclude more to the upside even if it is only a few days.
Intermediate term market breadth says correction is running for a few weeks and it is not complete, cycles - we should see a few weeks lower for 20w low counting a low at w12 or w14 looks strange, the pattern from the top in June looks incomplete.
My conclusion - even if we see a few more days higher for the patterns(from 12th of June low) to be completed, 2-3 weeks lower should follow.


TRADING
Trading cycle - the trigger switched to buy with price and RSI crossing above the MAs. The problem is, as explained above, none of the tools show support for this buy. The trigger produces false signals in sideways patterns like flat or a triangle and this are the suspected patterns mentioned above. Now is waiting for the situation to be resolved.


TECHNICAL PICTURE and ELLIOTT WAVES
Short term - I was watching for c wave to complete a flat. So far it works and now waiting for confirmation for reversal or not.
If we do not see reversal possible pattern is bigger flat(yellow) and the weaker indexes DJI,NYSE,RUT completing triangle.


Intermediate term - it looks like a correction is running and currently wave b. Wave c lower should follow to one of the support levels and Fibo retracement.


Long term - I have the feeling the bull market from 2009 is over. I was expecting an ugly sideways correction for at least a decade, it seems it has began in 2018 and so far it did not disappoint.
One leg was completed in March 2020 and now X or B running.... the cycles create really nice echo(the circles) which is only confusing where the major high is.
If Jan.2018 was the high for the bull market and 4y cycle high than in October we should see the top of the second 18m cycle high and most likely X wave.
If Sep.2018 was the high for the bull market and 4y cycle high than wee should see the second 18m cycle high in 2021 and most likely B wave.
What we see currently is bad for the bulls - instead of decline for 2/V or b/B we are seeing very shallow sideways move for 20w low, which points to important high in October.


MARKET BREADTH INDICATORS
Market Breadth Indicators - the message is we are in the middle of a correction.
McClellan Oscillator - retracing after slightly oversold level.
McClellan Summation Index - sell signal.
Weekly Stochastic of the Summation Index - sell signal.
Bullish Percentage - in the middle of the range.
Percent of Stocks above MA50 - retracing, below 75.
Fear Indicator VIX - it looks like corrective retracement with one more spike to follow.
Advance-Decline Issues - in the middle of the range.


HURST CYCLES
Hurst cycles - another 2-3 days higher and it will look like 5w cycle high. If we see reversal on Monday than it is just 10d high and final decline into 20w low has started.


Week 15 for the 20w cycle. It will be strange if it is already behind us at week 12 or 14.