Trading cycle - the trigger is still on buy, but again I do not see a support for a buy from the other tools neither market breadth nor cycles nor EW says buy.
This daily cycle is much weaker compared to the previous two - strong 3/4 weeks higher and 3/4 weeks correction now we have 3 weeks higher and it is just testing the previous high.
As usual wait for close below MA10 to confirm reversal lower.

TECHNICAL PICTURE and ELLIOTT WAVES
Short term - very difficult to say what the last three days are... there is no impulse higher and there is no impulse lower to confirm reversal. Best guess ED to complete the pattern. With the price action this week I do not think we have one mega complex b wave rather two complex waves a-b(white labels) from a flat. So synchronized the SP500 count with the other indices, I think now they all have the same pattern. This does not change the big picture, still expecting c wave lower. The green count is speculation if we see continuation higher.

Intermediate term - SP500 made slightly higher high so theoretically we have divergences. Now expecting c wave lower.

Long term - I think the bull market completed in 2018. Since then a bunch of corrective waves. Currently watching this pattern... but with corrective waves often you have to adjust so stay open minded.

MARKET BREADTH INDICATORS
Market Breadth Indicators - sell signals and SP500 made slightly higher high so theoretically we have divergences.
McClellan Oscillator - above zero.
McClellan Summation Index - sell signal.
Weekly Stochastic of the Summation Index - sell signal.
Bullish Percentage - lower high, below 70.
Percent of Stocks above MA50 - lower high divergence.
Fear Indicator VIX - higher lows, I expect spike higher.
Advance-Decline Issues - weak, crawling slowly higher.
HURST CYCLES
Short term cycles - the sharp moves up and down probably caused by 5w high followed by 20d low and now the next 20d cycle rising and making M pattern aka double top. If this is the case next week we should see turn lower for 5w cycle low to complete the 20w cycle.
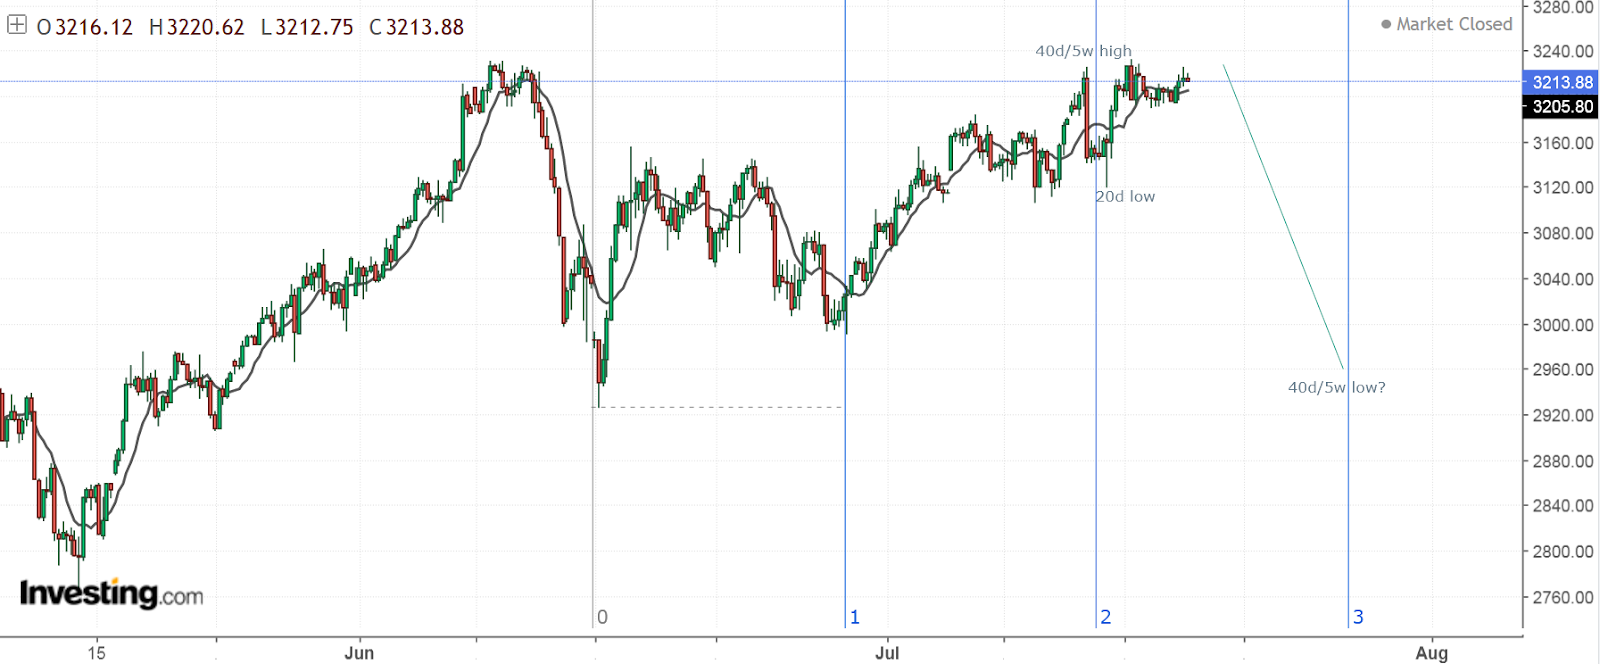
Week 17 for the 20w cycle. The time is ripe for a decline for 2-3 weeks to complete the cycle. Alternate late June was 20w cycle low and we are seeing M pattern similar to Jan-Feb.

Friday's close was interesting, thanks for the preview as always Krasi
ReplyDeleteI look forward to seeing the new charts each Saturday. But in some way, the short-term charts with sharp downward projections throw me off balance in my trading. It is so enticing to see a sharp decline forecasted in approaching days, but the probability of that happening is not always clear to me. And while I find this all interesting, I'm not a huge fan of the Elliot Wave for trading purposes. The reliability is not strong enough for me to trade by. But this is all very interesting stuff nonetheless.
ReplyDeleteThe sharp downward move has to do with both cycles and Elliot waves. They are in agreement for such a move.
DeleteFor trading is the first chart - there is no emotions waves what so ever. You can always wait for a sell to be triggered.
DeleteIt is not only EW, market breadth is on sell and the cycle is weak and it is time for a decline.
EW is very helpful to show you the pattern and what to expect. For trading the rule is to wait for confirmation impulse in the opposite direction and corrective retracement, but using MA10 is much more simple.
Krasi,
ReplyDeleteThe current move downward as you have depicted would cause alot of technical damage to simply stop at 2900 level and close below the 50 and 200 dma. The trajectory would likely continue after a retracement of 50 or higher on fibonacci scale. All this of course assuming we get a drop ;)
For the shorter term, the move lower and higher looks equally probable. Every move lower is being bought and prices being pushed back above the recent gap. On the other hand, we have not made a new high in a week and prices are unable to breakout of the narrow trading zone. 4hr 1 hr divergence favor the breakdown in strength but every breakdown is being bought!
The fact that I currently have a short position points to the obvious. Market will likely go higher!
Good luck everyone on your trades,
Kali
It is taking really very long time, but I do not think this will change something. Time and pattern will play out.
DeleteI think, nobody can fight the fed, they are going to print 1.2 trillion till the year end
ReplyDeleteIf you can not cope with emotions caused by trading - DO NOT TRADE.
DeleteYou are just getting annoying.... with the same bullshit over and over.
Just buy what ever you want when FED is the answer for everything.
finally.. yes, very annoying..
DeleteThe vix break the 200 MA and doesn't look good
ReplyDeleteSpy at resistance. I fight on!
ReplyDeleteSmall caps not confirming the move up
DeleteTech stocks the rest is red.
DeleteBecause all the move is the FANG
ReplyDeleteKrasi, this is ED or wave C?
ReplyDeleteMaybe bigger version of ED... I do not know at the moment. I do not see impulse.
DeleteMaybe 8 june 20 weeks low? I like more than 29 june
ReplyDeleteToo short....
DeleteNow we can start watching for completed pattern more complicated w-x-y/b from the one I have suggested last week - https://invst.ly/ricco
ReplyDeleteWe have second impulse and second zig-zag, NDX with triangle and impulse higher..
I believe the 20 week low will be end of july / early august and the 40 week and final low will be end of November / early December. could this make sense? thank you.
DeleteJP
Yes, it makes sense this is what I am watching at the moment.
DeleteKrasi what do you think about Oil?
ReplyDeleteNothing much to add similar corrective mess like the indices - most likely sell off for 2-3 weeks and higher for 40w cycle high
DeleteWith this move up is more likely 29 june 20w low?
ReplyDeleteIt is possible, but this is speculative scenario because I can not confirm it. Only after the fact when we see the price pattern in the next two months.
DeleteI don't get it. Why not 3 daily cycles?
DeleteI am expecting 20w low in a few weeks. The above scenario can not be confirmed so it is just a speculation at the moment.
DeleteIn theory there is no three daily cycles for one 20w cycle, so I am careful and watching for surprise.
Double top in Nasdaq
ReplyDeletelooking good
ReplyDeleteLets see impulse first and close below MA10, but now we have a pattern to work with.... before that was just waiting to see something which looks like completed pattern.
DeleteIt's breakout across the board, including currencies. I think the 20w low is behind us Krasi. The green scenario should be playing out now, whether we like it or not.
ReplyDeleteThere is no break outs there is tops with divergences across the board.
DeleteMaybe it is the green count... but I can not confirm it at the moment.
Painfull smackdown to 3050 or 3020
ReplyDeleteProbably it will last until tomorrow to see a top, but after that will high probability a smackdown.
DeleteYes it will come and will likely go below 2900, but in the short term it's clearly up for at least a day or even a week or longer. There are upside targets to hit first before I get interested in shorting.
ReplyDeleteKrasi I use neowave, DJi from 15th June is a dyametric as February to December 2018.
ReplyDeleteregards, Manuel
So you think we go down in 3-waves ie. zigzag like in Late 2018 rather than an impulse, once we top?
DeleteA chart will be helpful...
DeleteKrasi,
ReplyDeleteI have noticed that when we expect a next move to be lower and it does not fall, it pays to reverse our position with a tight stop. I have made a good deal of money trading this way recently. Whatever the expectation, always be ready to change with the circumstance.
happy trading folks and understand that flexibility is the greatest asset of any trading strategy.
- Kali
The cash index slightly different this will be the perfect completed pattern - impulse for c/B with RSI divergence and B hitting 123% extension around 3290 for expanded flat - https://ibb.co/RPY8q99
ReplyDeleteAnd 1 final move up in NQ as well to complete 5 of 5. I hope there's no further "extension" after this.
DeleteGood day Everyone. I think if we are closing daily above approx. 3239, market remains in bouyant position and can see higher prices into mid 3300 into month's end (around FED meeting dates).
DeleteAbout the dyametric now I don't have a computer available to upload charts.
ReplyDeleteNow we are as in late september or early october 2018. We must see a move down below 25400 as late october 2018, a rebound as november 2018 and finally move down 24500 as december 2018
What you are describing will take a few weeks rather than few months.
DeleteYes it is only to explain the dyametric, this is smaller than the 2018. I think 4-6 weeks to finish it
DeleteNow I get it just comparing the fractal.
DeleteToo much sun at the pool today melted my brain:)
Krasi what do you think about Silver?
ReplyDeleteThank you
The PM sector making 9y cycle high.
DeleteMedian line on this pitchfork is about 3300+ https://invst.ly/rj7p-
ReplyDeleteOne wave Up Krasi, and down???
ReplyDeleteImpulse lower on the 5min chart after divergence on the 1h and 4h chart - https://invst.ly/rjnwl
DeleteThe probability for another high is low.
How far do you think gold will go before correcting?
ReplyDeleteNo idea...
DeleteC wave comenceth?
ReplyDeleteIt seems it has began of course we need confirmation - a bigger impulse to develop to exclude another a-b-c.
Deleteok patience!
DeleteLooks promising like third wave from impulse...
DeleteNASDAQ under it's 10ma today
DeleteStill looks like an ABC correction right now, I guess tonight/tomorrow will be telling https://invst.ly/rjqpc
Deletelooking good for an oversold bounce soon. We're right at support now. I'll wait for the bounce and then go short.
DeleteYes, time for a bounce higher after nice impulse lower - https://ibb.co/mqVYBKb
DeleteClassical impulse - strong third wave subdividing itself in five waves, alternation in w2 zig-zag and w4 flat, 5=0,618x(1to3)
Bounce at least around the top of w4, but there should be more to the downside. Divergences on the 1h and daily chart broken trend lines... I do not see another turn higher.
I think we may still have wave E up to complete the rising wedge. If so we may test the 3290-3300 level in anticipation of pre-fomc next week before the real fun begins. we'll see.
ReplyDeleteJP
In any case not willing to be long or short before the week end. Too much risk on both sides.
DeleteI would not bet on this pattern.... ED fail most of the time and I do not see support from the indicators or other indices.
Delete