Trading cycle - sell signal. We should see a bottom soon for the third daily cycle and the next one should begin. The trend line hit again:)
Personally I am waiting for the next high - lower or higher high what ever it comes. This corrective waves are only for day trades.

TECHNICAL PICTURE and ELLIOTT WAVES
Short term - one possible pattern is diagonal which you have to construct differently on the cash index and the futures because you have overlap at different places. The futures overlap at the green arrow the cash index a few days later. Not a very good sign... not that the other count is perfect.
To be more precise we have to count double zig-zag w-x-y because we do not have impulses to call simple a-b-c.
Alternate if this is not the low a bigger diagonal like this

Intermediate term - most likely short term low and test of MA50 for 5w cycle high. Alternate we could see one more low, but not much lower slightly above MA200. MACD broke below zero - not a good sign.
Again main scenario we have a top early September and this decline is part of a bigger pattern lower. Waiting for now to see something convincing to put labels.

Long term - the bull market completed in 2018. Since then a bunch of corrective waves. Currently I think this rally should be a corrective wave of a bigger pattern flat/triangle or x wave. With corrective waves often you have to adjust so stay open minded.
RSI tested the broken trend line twice and we have a divergence - this has nothing to do with impulse.

MARKET BREADTH INDICATORS
Market Breadth Indicators - sell signals, but signaling it is time to look for a low.
McClellan Oscillator - bounce higher from slightly oversold level.
McClellan Summation Index - sell signal.
Weekly Stochastic of the Summation Index - sell signal, but reached oversold level.
Bullish Percentage - sell signal, but reahed levels where we see a low for a correction.
Percent of Stocks above MA50 - bounced from 25 where corrections usually are completed.
Fear Indicator VIX - doing nothing, most likely test of the previous low is comming before exploding higher.
Advance-Decline Issues - does not show a lot of weakness... we should see something higher.
HURST CYCLES
Short term cycles - lower into the next 20d cycle low, which is most likely 10w low too. Next we should see 3-5 days higher for 20d/5w high.
Alternate scenario one more low possible if the 20w low was late July.

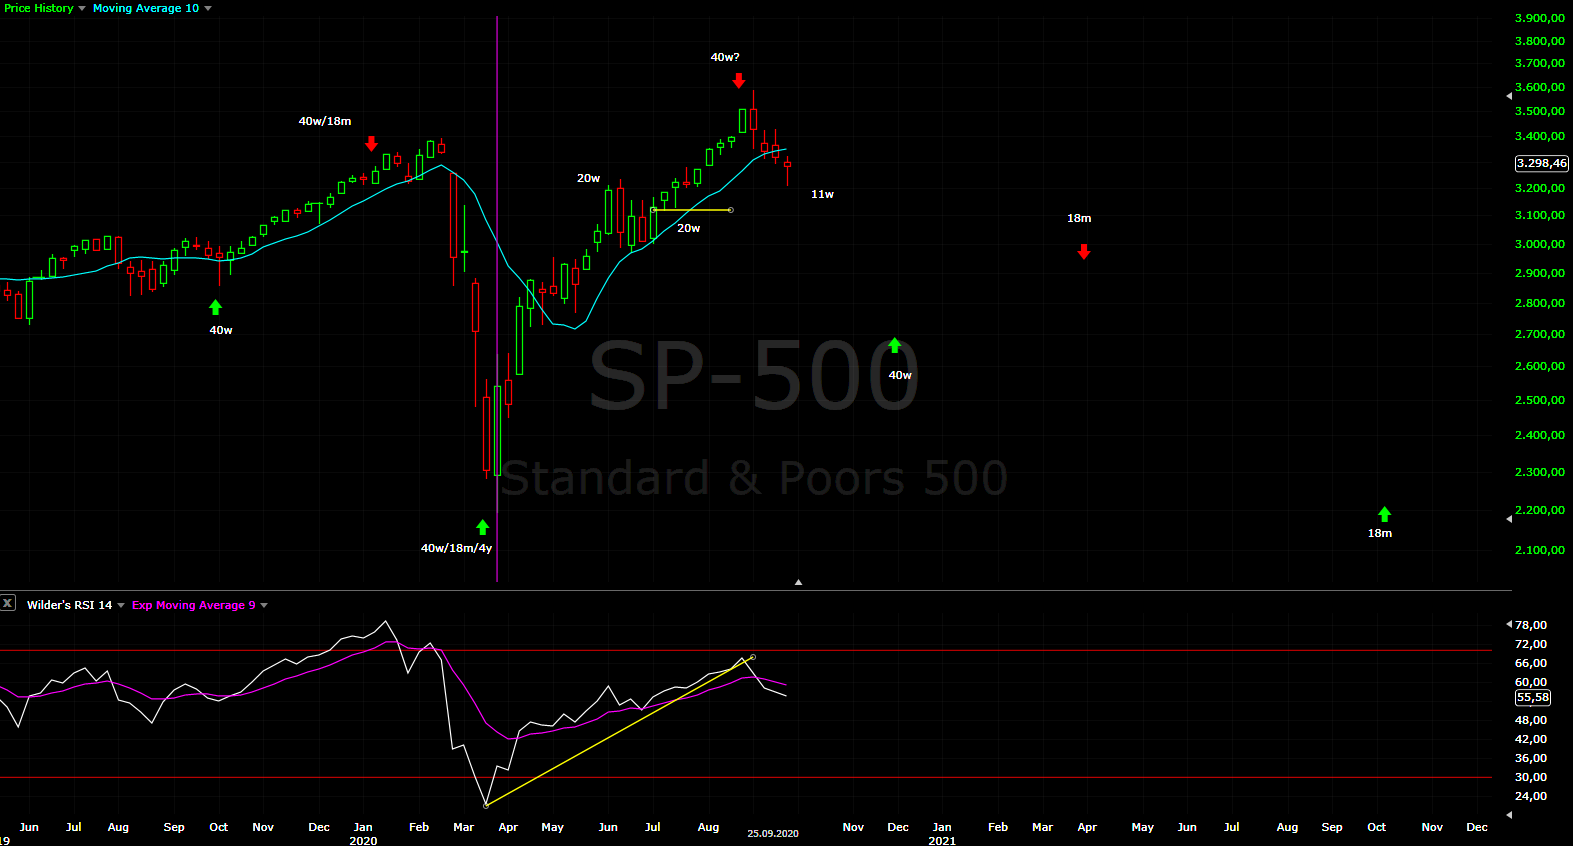
Week 11 for the 20w cycle. Now it looks official that the 20w low is not in June, but rather in July. 20w cycle with length 14 weeks followed by 10w cycle with length 13 weeks does not make much sense. For now sticking to the scenario with a low first half of July, but if we see one more low in the next 1-2 weeks than the 20w low was the second half of July.
The price and RSI are now below their MAs, which means 20w cycle turned lower. Very unlikely to be the first one from March with length 27 weeks, which means it is the second one declining, which means we have 40w high in September and decline into 40w low is running.
Good job Krasi.
ReplyDeletethis was probably leading diagonal for wave 1.
ReplyDeleteNot a big fan of LD... some are saying they do not exist and I tend to agree.
DeleteI think we are making a flat from January highs. We started C wave in September. This LD is the 1st wave. Expecting bottom around election time or even sometime after. The descent is alot slower so far then back in Feb/March so this makes me think flat is a better possibility than a WXY double zigzag correction. I doubt we break the March lows.
Deletenevermind, I think we make an ABC correction. We are only in wave 2 of A, so their is a long way to go before this is over. I think we get to 2840 first then big bounce then 2600 atleast. There is a deep crab harmonic pattern that formed from June 8th high to Sept high.
DeleteUp in october, down in november.
ReplyDeletelooks like a C wave started overnight
ReplyDeleteI see a very nice ABC from the top so maybe we are going to the top again or another leg up
ReplyDeleteES at resistance here under the canal
DeleteI think your wrong
ReplyDeleteWe'll see soon enough. Not much volume on the rise
DeleteMy problem is the vix
ReplyDeleteKrasi alternate in play imo
ReplyDeleteIt is possible, but first we have to see the impulse completed and fail(retrace bigger than 62%) after 5w high - https://invst.ly/saplg
DeleteI am not big believer in LD, but lets wait and see what happens after the impulse.
NYSE and NDX have no diagonals more like a-b-c flat 50% retracement and resistance - https://invst.ly/sapu5
DeleteThanks Krasi, yes, the retrace this afternoon was too much
DeleteWhere do you see s and p at end of October?
ReplyDeletethanks
It should be higher, but for a more precise price target we have to wait 1-2 weeks to see what kind of pattern we have.
DeleteIf Trump is deposed, the historical incumbent Pres. odds say that SPX will be < 3294 on Nov. 3rd. Since Trump losing seems likely, and if so the historical price odds are very strong for market +/- price on Nov. 3rd, what pattern would allow < 3294 on Nov. 3rd? This is a question that should be looked at carefully IMO.
DeleteTrump will win hands down
DeleteTrump "C"ovid wave.
ReplyDeleteWhat about oil?
ReplyDeleteNot much different... sideways move for a few weeks and lower into the 40 week low.
DeleteKrasi could this possibly be C of the A wave? In other words, B starts sometime next week?
ReplyDeleteI think we will see something taking time like a flat or a triangle so yes I expect b wave next week.
Delete