Trading trigger - sell signal.
Analysis - this is intermediate term high and a few months lower will follow.
P.S. - for a trade both analysis and trigger should point in the same direction.

TECHNICAL PICTURE and ELLIOTT WAVES
Short term - it looks like expanding diagonal and subsequent deep retracement... waiting for more price action.
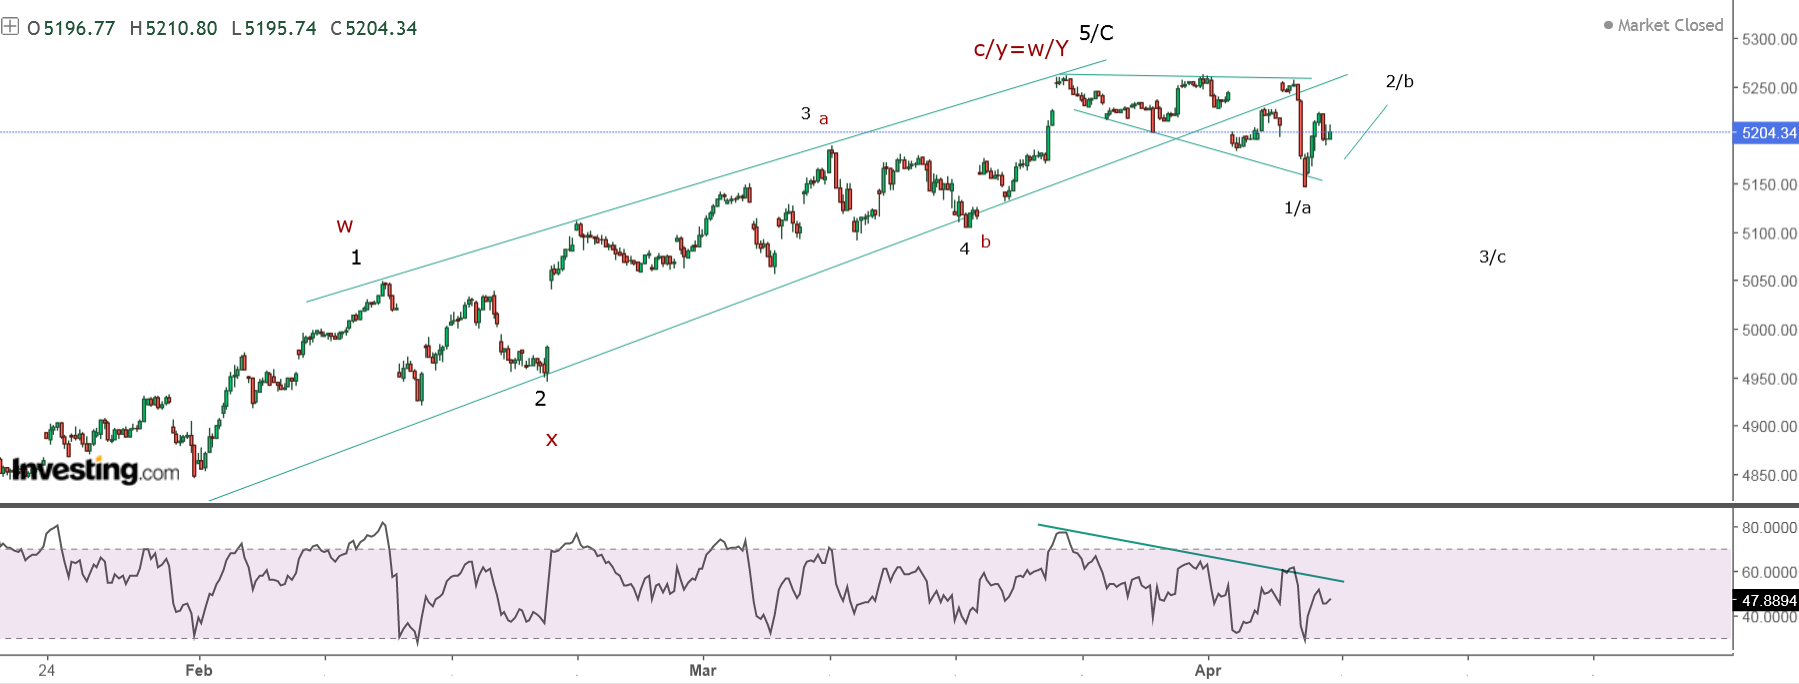
Intermediate term - zig-zag finished for intermediate term top and a few months lower will follow.

Long term - 4y cycle high the end of 2021, now a-b-c lower into 4y cycle low. Alternate this is the top of wave-B from 2009.

MARKET BREADTH INDICATORS
Market Breadth Indicators - turned lower after divergences.
McClellan Oscillator - moving lower.
McClellan Summation Index - sell signal.
Weekly Stochastic of the Summation Index - sell signal.
Bullish Percentage - turned lower below 70.
Percent of Stocks above MA50 - turned lower below 75.
Advance-Decline Issues - turned lower in the middle of the range.
Fear Indicator VIX - turned higher.
HURST CYCLES
Short term cycles - most likely 20d low and in a few days 20d high then lower around mid-April for 5w cycle low.

Week 23 for the 40w cycle. Probably 20w low at week 20 in March and expected 40w cycle low in June.
Week 35+1 high-to-high, at the top of at least 40w cycle... most likely 18m cycle high.
Average length for the 40w cycle is 32-36 weeks the last 40w low was 33 weeks long and now the high is 35 weeks long maybe the market is back to normal rhythm. In this case next important low is in June.

Aww - baby fall down
ReplyDeleteI think first 5w high next week
DeleteYou mean 5w low?
ReplyDeleteClose to 5w low... this week, latest Monday/Tuesday next week then higher. The 5w high - depends on where you start counting from 21 or 28 of March.
DeleteExpect px to go higher than March 28?
DeleteKrasi, do you mean it's gonna base at 5100s and bounce to ATH again? do you have a guide on chart?
DeleteFor dax it looks like 20w low
ReplyDeleteOnly looks like.... 6 months is too long. This is what I wrote many times 40w cycle visually consisting of 3x10w cycles - now we have 2x12 weeks and it looks like 20w cycle low.
DeleteIf it is 3 months rally for another 20w high should follow which does not make sense.
Big mess bit NDX shows clear pattern zig-zag lower w than higher x and now y is running when it is completed this will be 5w low - https://invst.ly/14dk55
ReplyDelete5060 now, is there a bounce coming?
ReplyDeleteYes
Deletewhat is the max it can go this round? some posting I see goes 5400!!!
Deleteno bounce?!?
Delete