Intermediate term view - we are in a topping process before a real correction of about 8%-10%.
Trading system signal (swing trading) - Direction:DOWN | Last entry signal: at SP500=1510 on 21.02.2012 | Stop at: 1533
The week played out perfect according to my forecasts - up to ~1532, lower after FOMC to support ~1500 and up to resistance ~1514. The only surprise for me was that the move lower started before the FOMC minutes.
Next week looks difficult to predict the short term. If the indexes reverse on Monday or Tuesday in the 1515-1520 area then watch the next support level 1475-1470. If they continue higher expect marginal new highs before reversal. As I have already wrote do not expect this first move lower to be waterfall it will be choppy pullback. I think we are witnessing a topping process similar to Mar-Apr 2012 and Sept-Oct 2012. Look at the choppy moves up and down for weeks. Such turns lasting only 2-3 days are difficult to predict.
In short - next week we should be flexible turning long or short but eventually the gravity will win and the next bigger move is lower.
TECHNICAL PICTURE
Short term - is not clear. SP500 closed at resistance and EMA50. As I have wrote reversal on Monday or we will see another signal up triggered.

- Triple cross(EMA10 and EMA20 crossing EMA50) - we have a triple cross pointing lower but on Monday we need reversal lower or we will see another triple cross up.
Intermediate term - topping process similar to Mar-Apr 2012 and Sept-Oct 2012. Waiting for the real correction, we will witness pullbacks up and down for a while.

- Trend direction EMA50/MACD - MACD is still pointing lower and we have a cross. Prices are above EMA50 and MACD above zero so this should be a correction in an UP trend.
- Momentum Histogram/RSI - momentum turned up. The bears need a reversal on Monday or the short term direction will turn up again.
Long term - No change waiting for correction and another move higher.

- Trend direction EMA50/MACD - MACD above the zero line and price above EMA50, the long term trend is UP. Quadruple divergence on MACD watch this veeeery carefully.
- Momentum Histogram/RSI - momentum turned lower which is a warning for a pending correction.
Cyclical Bull Market - I was playing this week with the monthly chart and find it interesting enough to share it.
TD Sequential and EW support my view that there is several months of upward pressure (green Y on the weekly chart above) and after that we should see serious move lower.

MARKET BREADTH INDICATORS
The Market Breadth Indicators - all issued sell signals confirming that move lower has begun.
McClellan Oscillator - always when the oscillator overshoots the BB a pullback in the opposite direction follows. The move up on Friday was expected.
McClellan Summation Index - issued sell signal.
Weekly Stochastic of the Summation Index - sell signal.
Bullish Percentage - issued sell signal.
Percent of Stocks above MA50 - confirmed the weakness moving bellow 75.
Fear Indicator VXO - moved sharp to the upside and overshooted the BB too, which means expect a move in the opposite direction.
Put to Call Ratio - at elevated levels telling us that we a re to a top.
Advancing issues volume - made lower low confirming the move lower.
Declining issues volume - made higher high confirming the move.
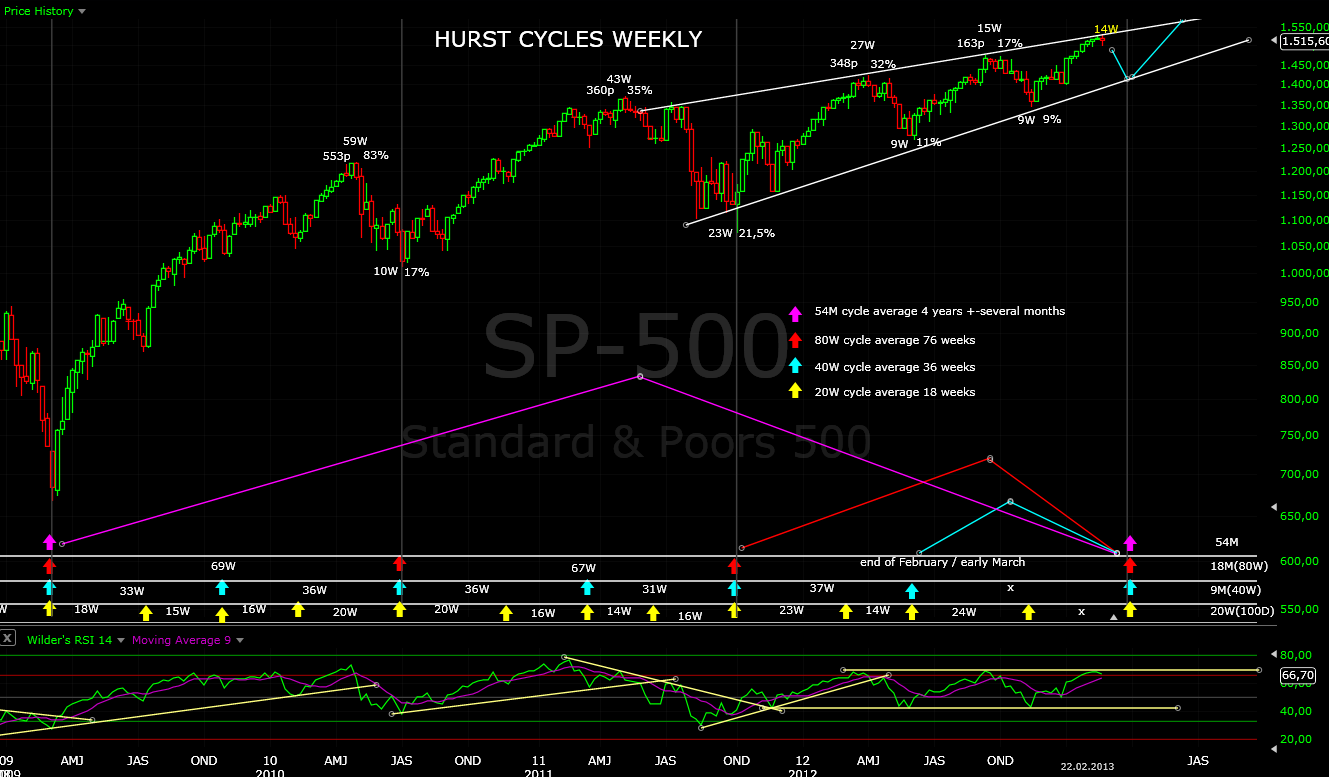
HURST CYCLES
Day 13 of the 20 day cycle. I do not think that was the bottom for this cycle. There is another 5 to 10 trading days before it bottoms which means the low of the cycle should be bellow 1498.

The cycle is mature at week 14 of 20 week cycle. 20 week and 18 month top should bring decent correction but the fact that they are topping late in the cycle means to expect more upside after that.
Tom Demark SEQUENTIAL AND COUNTDOWN - this technique spots areas of exhaustion.
Currently at 3 of a buy setup. Sp500 should close bellow 1511 on Tuesday so that the setup is not negated.

Nothing interesting on the weekly chart, the first red bar on the SP500 weekly chart. Eventually the correction should materialize.

No comments:
Post a Comment