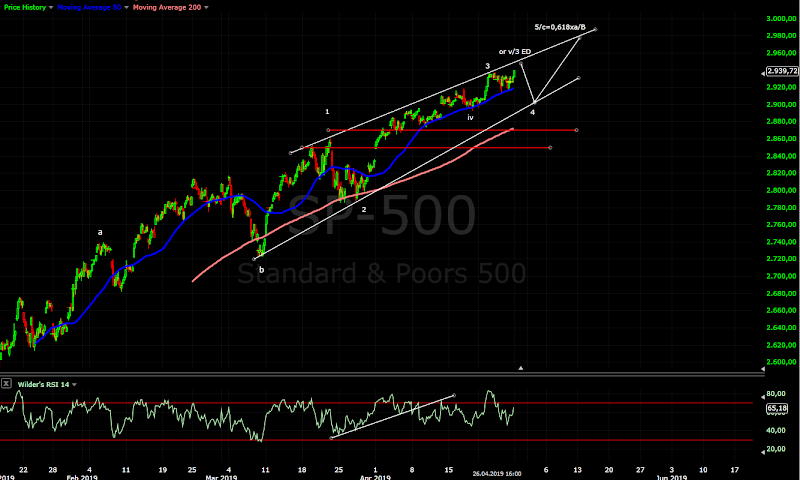
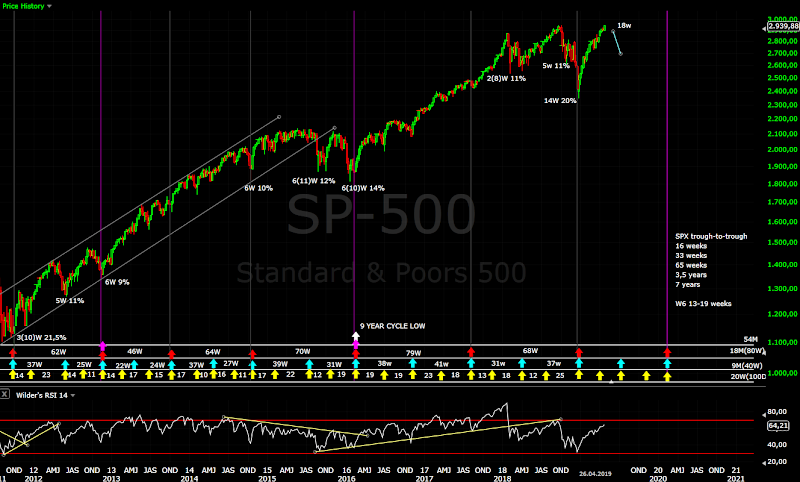
Another week the same price action - one day wonder followed by... nothing. The "strength" comes from the tech sector NDX/SOX, other indexes like NYSE,DJIA,DJT,RUT,XLF,XLE are lagging. After BA now MMM,INTC,XLNX with 10% gaps lower.... is this really strong broad based rally?
Overall it would be great to see one more pull back and higher high(what I am showing in the last several weeks) than we would have nice looking pattern.
TECHNICAL PICTURE and ELLIOTT WAVES
Short term - I will stick with this count until I see impulsive reversal. NYSE and DJIA with some corrective sideway move, SP500 drifting higher but I see three waves... either v/3 finishing as ED or flat for w4.
Intermediate term - pullback for 1-2 weeks for daily cycle low, to test support and MA50 followed by one more high will look great. This will be nice clean pattern.
Alternate is we have w-x-y from the low in Dec.2018, but I would not bet on such pattern until I see confirmation for reversal.
Long term - one more leg lower to finish wave IV from 2009. Decline in three waves and a low in Q1.2020 will fit better with cycles.
I do not know how to count an impulse, but if I am wrong it is wave 1/V.
MARKET BREADTH INDICATORS
Market Breadth Indicators - weakness most of the indicators with divergences, the next bigger move is lower.
McClellan Oscillator - below zero.
McClellan Summation Index - sell signal with divergences.
Weekly Stochastic of the Summation Index - buy signal.
Bullish Percentage - turned lower.
Percent of Stocks above MA50 - divergences.
Fear Indicator VIX - refuses to go lower.
Advance-Decline Issues - divergences.
HURST CYCLES
Day 33, decline for 1-2 weeks for daily cycle low expected.
Week 18, I suspect stealth 20 week cycle low and the coming high is of 40 week cycle degree.
Subscribe to:
Post Comments (Atom)


Any hint on Friday oil downside move ?
ReplyDeleteThank you
The same like the stock indexes - current pullback and one more high will look great for a-b-c.
DeleteIf we have reversal you have to count w-x-y... I have shown XLE chart on Thursday.
Krasi.
ReplyDeleteYour O-B is "Krashed".
And why is crashed? Because it made higher high? Like last year it made higher high just to sink like a rock.
DeleteThe same over and over and traders never learn. Do you remember what you were saying back then?
NYSE - back then and now, this time is not different.
Hi K -- two comments,
ReplyDeletefirst one editorial (no big deal on the English, but)
"Overall it [would] be great to see one more pull back and higher high(what I am showing in the last several weeks) [then] we [would] have nice looking pattern."
Second one ... more substantive
If the 2018Q4 move was a three, then why the predicted look of a zig zag and not a flat for the remainder of white IV? Or perhaps even more likely, a triangle IV?
Cheers!
Re the would vs will ... 'will' implies certainty. 'Would' is conditional/probabilistic in an if/then sense.
DeleteI know the rule, but in my mother of tongue is "will" with meaning "would"... writing quickly and this is the result:)
DeleteFlat is the obvious choice, but cycles do not look good.
Expanding triangle is very rare pattern, but cycles look perfect.
Some shares (example AMZN) with zig-zag so impulse lower should be expected other (example MSFT) with impulse and new high for important top probably w3 from 2009 so a-b-c expected for w4.
Short said it is 50:50 and my choice(not written in stone) is more feeling/guess which does not exclude wave C impulse.
First because of time - better looking cycles and correction lasting 1/3 time and price from w3(roughly numbers - w3 7 years and w4 2.5years instead of 1.5)
Second I think the herd should lose interest before the next leg begins(this is how the market works). The last final leg of the bull market is usually very violent and start when majority is not interested... for example I expect the indexes to double so SP500 around 4000 for 2-2.5 years.
If we see another decline for 3-4 months with V shape recovery will not do the job. Quick drop to 2500 "a", buy the dip the crowd exited again for 2-3 months "b" and disappointing reversal drifting lower 4-5-6 months will do the job - deceived three times, triple top, the bear market crowd very vocal, losing patience...
As I said this is just feeling, we will see what happens in summer. For starter we should see finished pattern and reversal with impulse before putting on the bearish suit:)
Sorry Krasi ,
ReplyDeleteI need to clarify : are you bullish or bearish for now ?
Is what you say : ( high probability )down to 2500 first and then up to 4000 on sp ?
As you speak of different time frames , i m a bit lost. Thank you
For now I am bearish - I expect one more leg lower.
DeleteThis leg lower could take the shape of impulse lasting 3-4-5 months or zig-zag(a-b-c) taking more time Q1.2020. The price target is the same the difference is time.
2500 mentioned above is just the first wave "a" for the zig-zag scenario.
When this leg lower is finished the final rally 2-3 years starts and I would not be surprised to see SP500 around 4000 or almost doubling.
The question is how high we go before 2500
DeleteIf we have this small 4-5 from the first chart around 3000.
DeleteNow everybody expect 3000 or higher with blow off.... but it looks more like September last year - just crawling higher a few points per day. So blow off is less likely, one day it will just plunge lower and 100 points will wipe out 2 months "vertical rally".
What would have to happen for wave C in summer?
ReplyDeleteI do not know... there is always some excuse.
DeleteProbably the liquidity drying up and everybody on one side of the boat and caught on the wrong side.
Hey Krasi what do you think that this is still iv of 3, and we still have v of 3 then 4? It would mean we go sideways to slightly high for another 1-2 years before a final blow off top, that is what I'm predicting.
ReplyDeletehttps://www.tradingview.com/chart/SPX/X8ycewvz-Wave-count-of-this-5th-and-final-wave/
Also, alot of people are expecting one last rally blow off top, so it would make sense if we are just stuck rangebound for 2-3 years to frustrate the masses before finally starting the last ascent.
DeleteI do not know the proportions does not look so good... w1 one year and w3 10 year or more.
DeleteI had this idea, I think I have posted a chart with this count because I was watching a lot of shares from tech and semiconductor sector which needed exactly this count - iv of 3 then v of 3 and 4.
But now most of them with strong rally and new highs and I have the feeling this is the missing v/3.
That is why I am talking about zig-zag decline taking longer - w4 for this stocks to synchronize with the indexes which have different pattern.
This is what I have tried to explain above - the herd expects easy money and this usually does not work.
DeleteThis 2-3 years are for me 2018 and 2019 for wave 4.
When the herd lose interest the next leg will begin. That is why I prefer the long scenario with a low in 2020.
This is the count that makes the most sense, wave 3 normally takes the longest, so not surprising. Where do you think v of 3 is? The rally from Dec low looks corrective and does not look like it's v of 3.
DeleteAbout the c wave in the summer, I mean when should wave c start? according to EW, hurst cycles, duration time .....
ReplyDeleteEW - Ideally one more pull back and higher high.
DeleteCycles - the 40 week cycle has average length 32-36 weeks the current one is week 32.
Around new moon there is a high - the next one is on 4.05 Saturday so on Monday 6.05 or later.
Statistically in a week or two:)
I prefer zig-zag not C, but for both the next important low is August.
What could go wrong - this is just 20 week cycle and next low will be the second half of May around 20.05
What is a projection for the next important low? Around 2500?
DeleteFor C 2150-2200, for a of zig-zag 2500-2550, just 20 week cycle low around 2750.
DeleteSo it is just a 20 week low, is that the final low if that scenario plays out, or will it go lower at some stage after? Thanks Krasi.
DeleteI will answer for Krasi. The market might go up, down or sideways.
DeleteThe low will be between 2150 and 2750 as indicated by Krasi. I hope this helps.
My god, this EW stuff is garbage, it's not funny anymore to be honest
To Unknown - 20 week low does not fit very good and looking market breadth and the weekly indicators it is unlikely to be the final low.
DeleteTo anonymous - you are so clueless. Typical amateur who thinks analysis/trading is on this date some index/share will have this price. Afraid of the unknown looking for safety - it does not work this way. For starter this is not a forecast, this are all possible outcomes.
DeleteThis is probability game - it is not about faith(I hope this will happen) or I am sure(this must happen) it is about to be prepared for different outcome. I do not fall in love with counts scenarios etc. I am looking at all possible scenarios to be prepared and let the market show the path.
When you see one of this playing out you know what follows.... but hey this is useless information.
can we assume today was wave 4?
ReplyDeleteDifficult to say NDX/NYSE look like w4 SPX/DJIA shallow looks more like iv/3
Deletehttps://imgur.com/a/hjppW4w
ReplyDelete3000 can easily happen hear or maybe 3028
DeleteI do not understand: If current 40 week cycle started in december, Why the current one is week 32 ?. I think we are in week 17
ReplyDeleteThis is high to high analysis from the September top.... and it says the coming high should be of 40 week degree.
DeleteDo you think yesterday showed an impulsive decline of any kind?
ReplyDeleteIt looks impulsive to me....
DeleteBut this could be the c/4 from the first chart.
Deletehttps://imgur.com/a/luiQYQE
ReplyDeletelooks like apple going to 223 buy summer
DeleteMore like this - https://imgur.com/a/ThWpXfN
DeleteThis 1-3-5 which you are counting must be impulses five waves not a-b-c.
Watch RSI and its trend lines it shows you where a wave start and ends and when the whole leg is finished.
Look at RSI on my chart the first trend line shows you when the first wave was finished. On your chart this is in the middle of wave 3. Such break of the RSI trend line will never gone a happen in the third wave.
The second RSI trend line for the whole leg up from the January low is broken so 5/C is already running or it is finished.
i think the market will go ack up to 2960 to 2980
DeleteThis is the plan one more high....
DeleteHi Krasi, on the 15 minute chart, don't we have an expanded abc starting at the end of the april 19 session and ending on May 2? Thank you
ReplyDelete