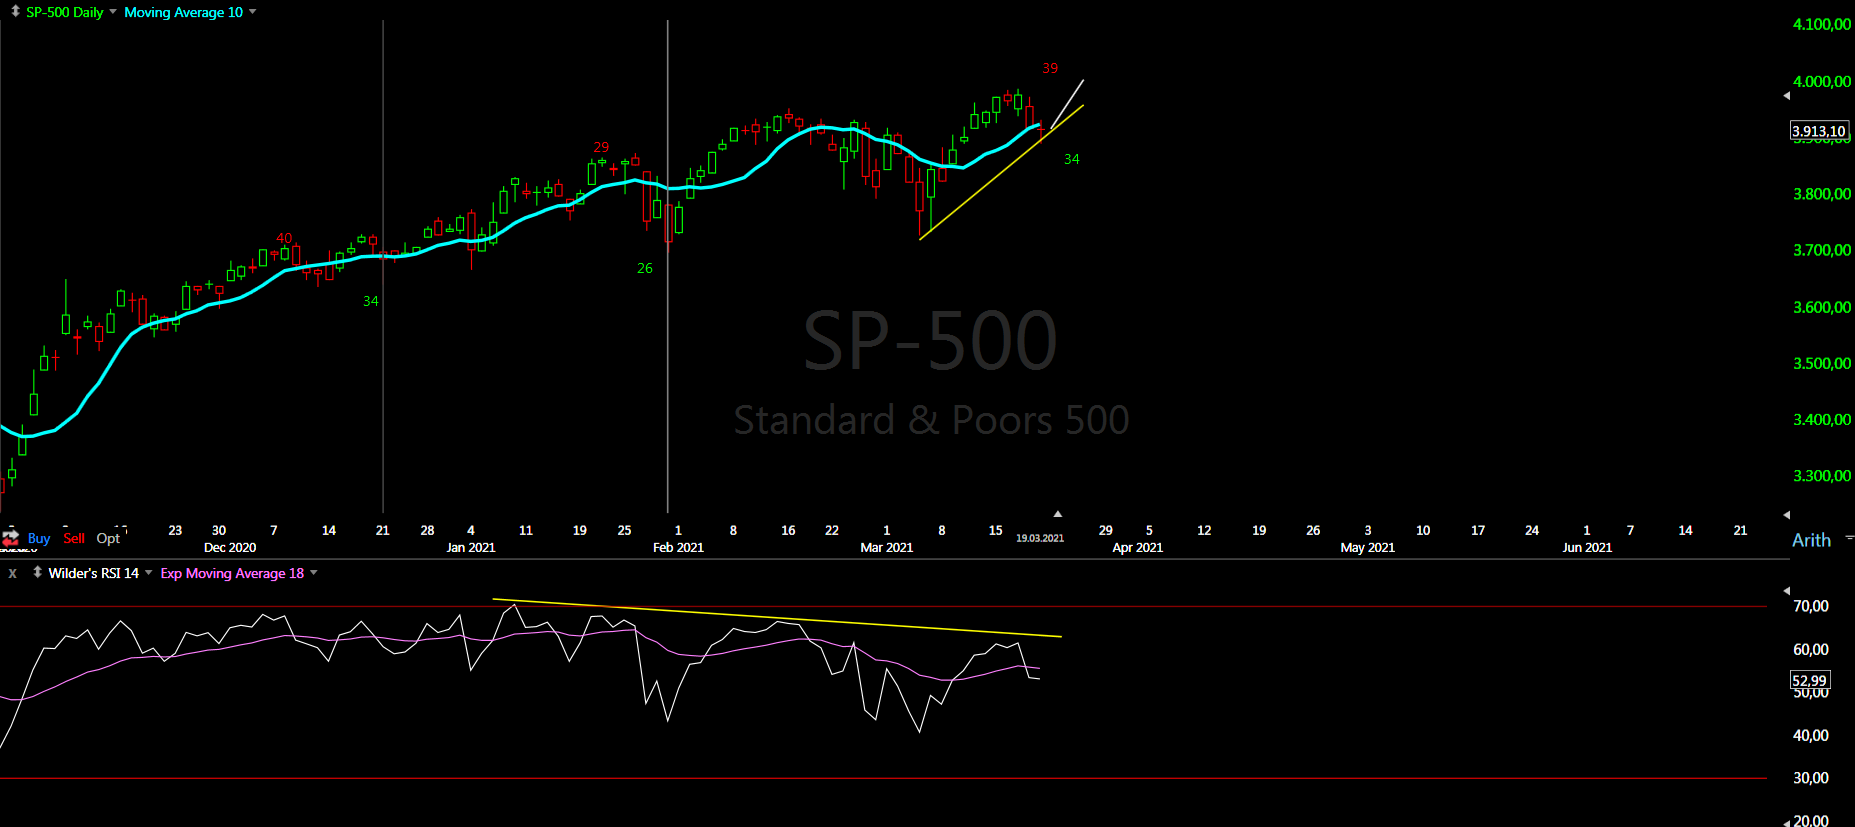
Trading cycle - buy signal. Again right translated 20d cycle finding support around MA10. We should see one more high before reversal. High-to-high daily cycle a few more days and it will reach the average length and this should be intermediate term high at least.
TECHNICAL PICTURE and ELLIOTT WAVES
Short term - I see one diametric completed.... again if this is the top we should see sharp decline next week if not it is just wave a. Alternate with one more 5w high I have to shift the labels d-f to the right or count diagonal C-wave.

Intermediate term - I see one big zig-zag up. You can count it as W-X-Y(white) classic EW, but we do not have impulses. More likely series of zig-zags A-B-C(yellow) with the C-wave as a diametric. Besides market breadth and indicator divergences, almost every index shows similar pattern from the November low - complex structure with many zig-zags. That is why I can see extension for 2-3 weeks, but another 2-3 months is fantasy for me.

Long term - what if something else is going on? NYSE chart below for a clear pattern without tech stocks distortion. - First option the main stream got it right(I would not believe this even if I see it:) - we have impulse and this is the fifth wave. So with clear corrective leg this is w1 of ED. Than we need waves 2-3-4-5 and sometimes next year it is completed with 4y cycle high. This is the high for mega wave (III) from the low in 1929 and huge sideways wave (IV) begins. Usually it retraces to the low of the previous wave4 of lower degree (the 2009 low) and it will take decades. Personal opinion - it is more than clear from 2009 this is not an impulse. It is the same crappy corrective structure as the current move from the March.2020 low. Please do not try to explain me - no it is not an impulse. - Second option Neely is both right and wrong - right because the correction began in 2000 and it is a triangle, but wrong because it is not neutral triangle. In neutral triangle the C-wave should be the longest and the most complex wave and it is not. He tries to make it fit and counts the C-wave bottom in 2010. In this case the triangle is expanding triangle from 2000 with complex D-wave diametric. Depending on where you count the previous 4y cycle high(Jan.2018 or Sept.2018) this could be top of the D-wave or one more zig-zag up next year. Then comes the E-wave and the 70%-90% decline, which Peter Eliades is talking about. Neely's count is like a walk in the park compared to the alternative scenarios. Imagine what will happen in the real world if we have 20-30 years economical problems(first option) or 1929 style reset Great Depression v.2(second option). I pray that Neely is right, but my mood gets darker with every day watching what happens around me..... and I feel something very nasty will happen.

MARKET BREADTH INDICATORS
Market Breadth Indicators - many with long term multiple divergences. The indices should be close to a top of higher degree.
McClellan Oscillator - below zero, one more high for divergence?
McClellan Summation Index - weak, multiple divergences.
Weekly Stochastic of the Summation Index - neutral.
Bullish Percentage - reached 70, multiple divergences.
Percent of Stocks above MA50 - reached 75, multiple divergences.
Fear Indicator VIX - one more test of the low and almost closed the gap.
Advance-Decline Issues - lower high, multiple divergences.
HURST CYCLES
Short term cycles - this week should be 20d low next we should see 20d high. Changed the weekly labels for the alternate scenario with one more 5w high.

Week 7 for the 20w cycle. What if something else: - first I am trying to extend the 18m cycle - I would say one more 5w cycle is ok... even looking better. More extension makes zero sense.
- second I am trying to count the February low as 20w low and I can not. Between the September and February highs you have almost six months this means you have 20w+10w highs and this means somewhere between this two highs you MUST have 20w low and this is the January low not the February low.
This is the alternate model - the difference is one more 5w cycle for the 18m high.

I see 2 problems with the triangule of the nyse according to neely rules.
ReplyDeleteThe duration of wave D, it last too much. In a triangule must be DA in time
And the wave C last less than the wave A. In all the triangules C>A in time
DeleteIn the first post I meant in a triangule must be D<A+B+C in time
DeleteThis is what if, it is not about to proof that Neely is wrong... but you are right the rules should be applied.
DeleteOk the C-wave is more complex - triangle and not the E-wave - https://ibb.co/YNjyxkg
About the diametric in bow tie that you show in that triangule the wave B must be 62 of A in price.
ReplyDeleteI have a alternative: year 2000 W, 2002 X, and from there the diametric: 2008 A, 2009 B, 2015 C, 2016 D, February 2020 E, March 2020 F, and now G. The diametric will must go back itself. It is your 3500 of nyse.
PD: It is usual one of the legs in a diametric is very small or very big in time with respect to the others (I say this for the wave F so small)
I am not a big believer in expanding triangles and I am talking about two such triangles:)))
DeleteSo I will not be surprised if it is something else, but I doubt the outcome will be different.
I don't think this is a zigzag. The last waves from September onward are forming a triangle/wedge. If anything it is a WXY pattern.
ReplyDeleteI also think we are not done going up yet, one more high into April will make sense.
Krasi, if March 2020 was an 18m low, wouldn't the next low be SEPTEMBER 2021, and not June? You've been saying June 2021. Thank you.
ReplyDeleteThe cycles are running shorter than the nominal model like 16 months and sharp decline is expected - the faster the move the shorter the cycle... fear is very powerful emotion. Last year in March 2020 we have 10 weeks missing.
DeleteKrasi, I like your green ED line into 2022 in your long term chart. I think that's where we are heading. We'll see. Thanks for your work.
ReplyDeleteJP
after watching for a week or so , this seems a good entry for the lower high . Low risk and 100+pts on offer if it's right . Should decline into Thursday/Friday this week , so not long to find out .
ReplyDeleteThanks Krasi,always appreciated.
ReplyDeleteI think we top this week. I'm looking for 2900-3000 by Mid-June. This is very similar to 2008-2011.
ReplyDeleteCrude oil is this impulse lower? Five waves 3=1,618x1 and 5=1.
ReplyDeleteI have not seen impulse for so long that I have doubts now, when I see something looking like impulse:))))
Looks like it, better seen in USO hourly
DeleteIn the last three years oil and the indices move in sync and either makes a top at the same time or a few weeks earlier. This is a big red flag.
DeleteHope so, 50 should be first target on oil
DeleteYou've made it very clear there is no impulse
DeleteHe meant impulse lower https://www.tradingview.com/x/vmnQlVlq/
DeleteSo probably abc bounce up now
DeleteOne more interesting chart: https://www.tradingview.com/x/fSzaW3jE/
DeleteVVIX = Vol of Vol, meaning options on VIX are getting more expensive (higher lows) long before underlying VIX spikes, this is usually pro market only so good indication pros are seeing turbulence ahead
DeleteSent a comment earlier. Another observation over past few weeks is pretty much everyone around me talks about "investing" in stock market, just overhead some guy on the phone explaining his friend he's been getting rich in stock and that stocks will go up for next 1 year. Othe guys talked about Kathie wood and Tesla. I remember the same observation about bitcoin at the end of 2018. I went too the pub with coworkers and everyone was bitcoin expert, I said to my self this is it, and it tanked few weeks later. Now the sentiment is just confirming what the charts are saying, VVIX & VIX BB compression and pinch, record low short positions, no hedging and record margin debt in stock market. I think we,re close to some important high
ReplyDeleteYes, 18month high and the bulls will be lucky if we see only 50% retracement.
DeleteRut looks like the shining elevator scene
ReplyDeleteKrasi, 50% retracement is less than 2000
ReplyDeleteTimber
ReplyDeleteAs near as I can tell, we are looking at scenario #3, which is headed for 1 last 5 week high in mid April. Am I intrepid this correctly?
ReplyDeleteFor now this is the preferred scenario, but it should take more time.
DeleteIf we see reversal today and rally into next week it is more likely the second - this b-wave(second chart) just taking longer.
I watch VIX pre-covid gap of FEB 2020 as a final indicator for intermediate top. Once that is filled.
DeleteES can run closer to 4200 in this last wave. NQ may only show double top at the same time.
got most of the 100pts I wanted from the lower high . Looks like we get some midday chop today and then maybe a lower low into the close . 3830-40 should offer support later .
ReplyDeleteDon't think this is a bottom today - although more encouraged by bonds and f/x.
Highest odds for me is a 1-2 rally starting later/tomorrow, then fresh lows into month end .
If the low at month end is above 3720 , then I agree we see fresh highs in April .
rally was the right call - monday morning for a retest of 3955 on the cards now? Then another go for a bit more than 100pts on the short side .
DeleteI think March 17 was an important high in the sp as I thought then. If true we just started wave A of and ABC corrective move down for 2/B of the ED, which should bottom in late summer. We'll see.
ReplyDeleteJP
yesterday look like 10w low?
ReplyDeleteIt does not feel like 10w low....
DeleteSorry, 10 day low :)
Delete