Trading trigger - buy signal, in the time window for a top.
Analysis - long term sell the rips, we have major top. Intermediate term high in the next weeks and lower for 2-3 months.
P.S. - for a trade both analysis and trigger should point in the same direction.

TECHNICAL PICTURE and ELLIOTT WAVES
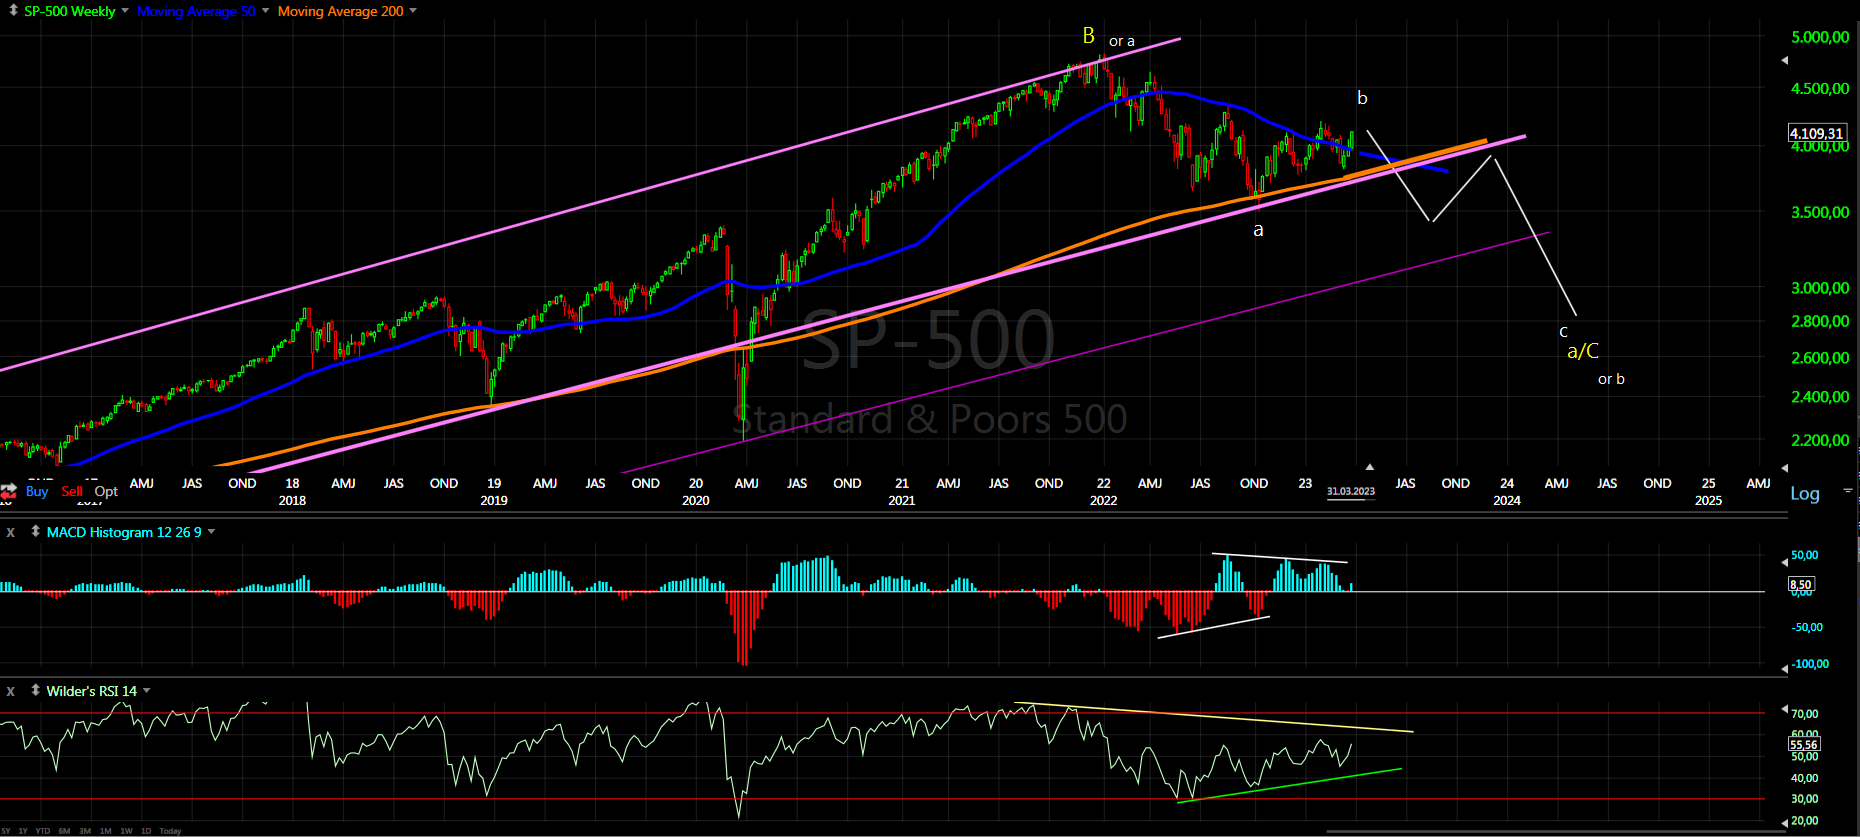
Short term - if there is more to the upside. Alternate it is the b-wave from last week completing zig-zag and reversal lower next week.

Intermediate term - if we see continuation for another week or two the pattern will look like a-b-c with sideways b-way. Cycles have not problem with that - all 10w/20w/40w cycle lows and highs count very well.

Long term - most likely huge double zig-zag from the 2009 low B-wave was completed and multi year decline has started. If we are lucky it is lower degree b-wave.
MARKET BREADTH INDICATORS
Market Breadth Indicators - turned higher, it is more likely this to last for a few weeks.
McClellan Oscillator - close to overbought level.
McClellan Summation Index - buy signal.
Weekly Stochastic of the Summation Index - turned higher.
Bullish Percentage - turned higher.
Percent of Stocks above MA50 - turned higher.
Fear Indicator VIX - is declining.
Advance-Decline Issues - moving higher.
HURST CYCLES
Short term cycles - 20d high next week and lower for 20d low expected. This 20d cycle looks strong so another high is expected. On the other side the indices are in the time window for 10w high.

Following this pattern and sticking to the theory we should count 20w low 3 weeks ago and now higher into 20w/40w/18m high. This is already week 17 for the 20w cycle high and week 33 for the 40w cycle... the average is 16-18/32-36 weeks so the indices are already in the time window for a high.

Thanks Krasi
ReplyDeleteMuchas gracias desde Spain!!!
ReplyDeleteKrasi, what is your opinion on DXY?
ReplyDeleteI think something like this - https://invst.ly/-p9yn
DeleteThank you Krasi!
DeleteIf the dollar is going down, the stocks are go up
ReplyDeleteWith gold and Bitcoin
ReplyDelete