Short term view - probably a pullback to MA50 on the hourly chart.
Intermediate term view - waiting the choppy move to finish and a correction for 2-4 weeks.
So my preferred scenario ED is playing out. The European markets were giving the hint, but with this indicators I prefer to follow the market not my feelings:) The trading plan was ok if you were flexible and ready to change the direction without to hesitate.
Short term - I think any move lower will bounce up at support and MA50 (see the hourly chart). After that if you see a lower high or higher high with divergence than it is time for shorts.
Intermediate and Long term traders - WAKE UP:) after three months in coma I think the market will start moving again. What I expect is a standard pullback 4%-6% for 2-4 weeks, than the highs to be tested marginal higher high or lower high we will see and than a bigger correction 10% (see the daily chart).
For the swing traders it easy - just follow the market and the swings. The long term traders should think about it twice... there is high probability that this is an important top. You can take for example 25% profits after the current move tops out and another 25%-50% after a failed retest of the high and open short position. It depends on you but have a plan with double divergences MACD and RSI on the weekly chart do not be the bag holder.
TECHNICAL PICTURE
Short term - the smaller time frames show show triple MACD divergence... I suspect a drop to support/MA50 and than we will see what happens.
- Triple cross(EMA10 and EMA20 crossing EMA50) - short term trend is up.
Intermediate term - this is what I expect in the next several months. Pullback to MA200 and lower trend channel(yellow), retest of the highs and a correction to the lower trend channel(purple). The SP500 can not move above the middle trend line which is a sign for a weakness. If I am wrong the market should prove it and blast above it with target the upper trend line.
- Trend direction EMA50/MACD - the intermediate term trend is up, but the divergence is a warning sign for a pending trend change.
- Momentum Histogram/RSI - momentum is up
Long term - I do not think that any move higher will clear the MACD divergence and start another long lasting rally. I think the next big move will be lower, but it could last months until we reach this point.
- Trend direction EMA50/MACD - the long term trend is up - the price above MA50 and MACD above zero. The MACD divergence should make you worry, that the long term trend is topping.
- Momentum Histogram/RSI - momentum is up.
MARKET BREADTH INDICATORS
The Market Breadth Indicators - turned up but nothing special... no confirmation of a strength.
McClellan Oscillator - moved above the zero line.
McClellan Summation Index - still sell signal and lower high...
Weekly Stochastic of the Summation Index - sell signal.
Bullish Percentage - massive divergences, but short term still above 70... sell buy signal.
Percent of Stocks above MA50 - can not move up to 75... internals veeery weak
Fear Indicator VIX - extreme complacency.... just a hundredth from the lowest reading for the whole bull market
Advance-Decline Issues - in the middle of the range.... internals veeery weak
Put/Call ratio - I suspect the next lower high....
Percent of Stocks above MA200 - another lower high....
HURST CYCLES
Day 29 - we should see the indexes moving lower soon towards the expected 40 day and 80 day cycle low.
Waiting for a correction to finish the 20 week cycle....
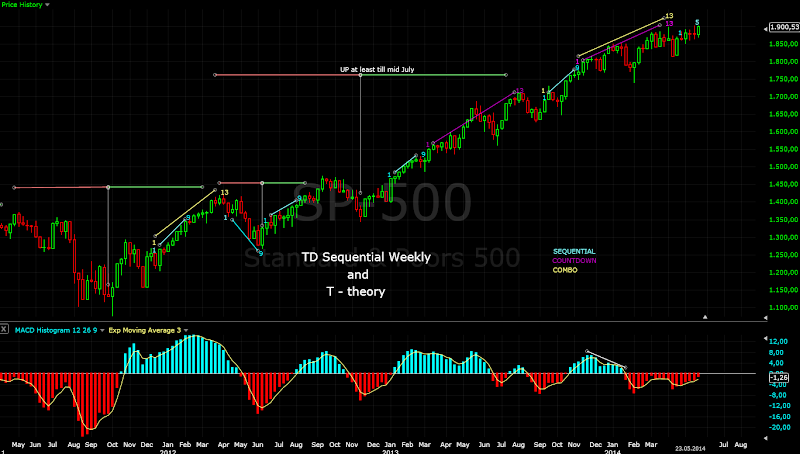
Tom Demark SEQUENTIAL AND COUNTDOWN - this technique spots areas of exhaustion.
Another price flip... choppy moves nothing interesting.
It is interesting that even with all this choppy moves we have 5 of a setup on the weekly chart.
Subscribe to:
Post Comments (Atom)


Interesting analysis!!! Very informative!
ReplyDeleteI think this rally may extend till 1925~1945 zone before we could see some 2~5% pull back...
Yes, there is more upside. I was hopping for a small pullback.... but no chance.
Delete