Trading trigger - sell signal.
Analysis - long term sell the rips, I think we have major top which will be tested one more time. Intermediate term - 1-2 weeks for intermediate term low.
P.S. - for a trade both analysis and trigger should point in the same direction.

TECHNICAL PICTURE and ELLIOTT WAVES
Short term - still waiting to see which pattern will play out... the outcome is the same.

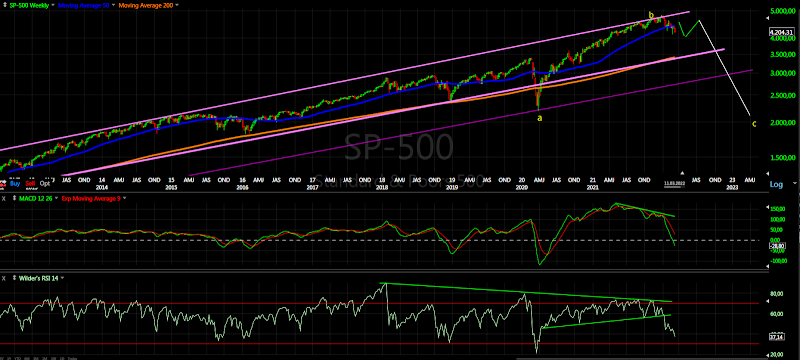
Intermediate term - I see W-x-Y(yellow) with complex double zig-zag for Y=W, alternate we have Z-wave(red). It seems that we should see one more low before turning higher.

Long term - topping process running for months and maturing. Some kind of corrective wave b-wave and c-wave will follow.
MARKET BREADTH INDICATORS
Market Breadth Indicators - the same like last week... I guess one more low with divergence.
McClellan Oscillator - oscillating around zero.
McClellan Summation Index - trying to turn up.
Weekly Stochastic of the Summation Index - turned up.
Bullish Percentage - turned lower.
Percent of Stocks above MA50 - bouncing around oversold level 25.
Fear Indicator VIX - looks like a wedge and time to retrace.
Advance-Decline Issues - in the middle of the range.
HURST CYCLES
Short term cycles - It looks like we have 20d low and now higher into 20d high or even completed... after that we should see intermediate term low 10w low.

Week 14 for the 20w cycle(for the case with 18 low in July).
Long term we have 4 year cycle high and transition from up to down. The 18m low either late September with one extra 20w cycle or alternate on time in June/July... waiting to see how the pattern will play out to confirm one of the two options. In both cases I expect highs echo from 2018.

Thank you, that hard rejection on Friday at open makes me think down into fomc. Have a good weekend!
ReplyDeleteIt would seem so and everyone would think the same. I wonder if we go to 4350 into FOMC since we saw around that level in pre-market on Friday to trap the bulls n then one more swoon to 3900s. This scenario will chew some time as well. Otherwise the bottom exactly in mid-month seems a bit unlikely to me per previous month/year patterns.
DeleteYou had recommended a timeline for buying gold. Based on everything that is going on and the recent events, would you change that timeline?
ReplyDeleteThere is no anything to change... PM will go lower another hysteria at the next top.
DeleteQuick look at silver and miners will confirm it.
A lot of hysteria about commodities ... crude oil - https://invst.ly/xnsa0
ReplyDeleteIs it time to buy or sell the hysteria?
This is wrong imo. We had major cycle bottom in April 2020. We finished 5 waves up of a larger cycle, we are now in wave 2, the next buying opp will be huge because we will then go up in wave 3.
DeleteAccording to Neely your count doesn't fit, wave B should be the longest in time.
Seems that would match a possible gold scenario as well
DeleteIs it possible we already saw the low?
ReplyDeleteIn theory yes, if you switch to weekly chart you can count 7 weeks so in theory it could be 10w cycle low.
DeleteIf we saw 10w low, does a new cycle start here? What happens to the 20w low?
DeleteI removed my bullish comment after I looked at djt 🤣
ReplyDeletewhy what do you see in DJT? Its been up too?
DeleteIt's been very bullish, but now at strong resistance with rsi divergences so I think it's warning of a pullback here
Delete