Trading trigger - sell signal, we should see soon intermediate term low.
Analysis - long term sell the rips, close to potential major top. Intermediate term close to intermediate term low. Trades depending on your time frame.
P.S. - for a trade both analysis and trigger should point in the same direction.

TECHNICAL PICTURE and ELLIOTT WAVES
Short term - no new information so the same patterns.... looking at RSI daily it should be an a-b-c pattern from the November high. Part of what is this a-b-c, b/Z or something else is more difficult question.

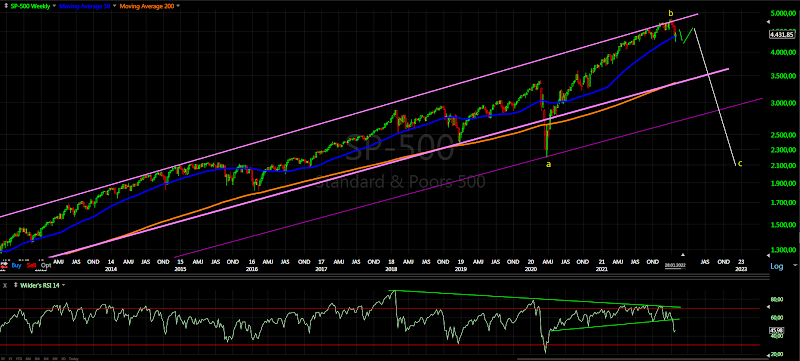
Intermediate term - I see three zig-zags with roughly the same length in time W-x-Y-x-Z or possible W-x-Y with complex double zig-zag for Y. Struggling below MA200 and the trend line not so bullish. Bearish(red) and bullish(green) outcome shown for the coming bounce.

Long term - topping process running for months and maturing. Some kind of corrective wave b-wave and c-wave will follow.
MARKET BREADTH INDICATORS
Market Breadth Indicators - the same like last week, the indices should be close to a low, but there is room for another decline.
McClellan Oscillator - bounce from oversold level.
McClellan Summation Index - sell signal.
Weekly Stochastic of the Summation Index - sell signal.
Bullish Percentage - levels where usually an intermediaterm low is seen.
Percent of Stocks above MA50 - nearing oversold levels.
Fear Indicator VIX - higher low followed by higher high... trend reversal???
Advance-Decline Issues - oversold level reached the sell off is showing strength.
HURST CYCLES
Short term cycles - it looks like second 20d cycle high for 5w high. After that we should see something like one week lower for 10w low(probably 20w low too).

Week 17 for the 20w cycle. Long term I am expecting 4 year cycle high. The 18m low either late September with one extra 20w cycle or alternate on time in June/July... waiting to see how the pattern will play out to confirm one of the two options.

Monthly candle impressive wick. Most of it today.
ReplyDeleteThe RSI has not made a low like the one on Jan 27th since the covid lows. I seriously doubt this market is going to sell off much more, a pullback for sure but a crash seems much less likely now with this rally.
ReplyDeleteI've been seeing this point about indicators being oversold a lot on Twitter, implying the worst of the selling is over and we are ready to rally to ATHs. I don't see it that way at all. The first thing is the fact that RSI even became oversold on SPX daily is a strong sign this isn't just another bull-market correction and more likely the start of a bear market.
DeleteSecond, I think the first low to buy for a bear-market rally should have a solid bullish divergence (above the 30 line) on daily RSI. Look at the March 2020 covid low example: https://i.imgur.com/Aac85kb.png
Ideally we see something similar for a buy signal where you have the first leg go deeply oversold (accomplished last week), the next leg go moderately oversold and finally a low that doesn't cross into oversold at all. If we are in a real bear market the next rally (March/April) may be violent and impressive, but likely won't make a new ATH.
For those that follow Neely, we reached his Stage 3 confirmation (90%+ probability) of a bear market on the 24th: https://www.neowave.com/tradingblog/blog.asp?bid=157
No need to be a crash... steady selling is the sign that the tide is turning.
DeleteHi Krasi, I believe January 28th (not 24th), was a 10 week low and there is one more 10 week low expected at the end of March/early April that will be significantly lower than the January low and will represent a 40 week low as well.
ReplyDeletethere is four months between the last two significant lows so I would say 20w low. Another 10w cycle does not make much sense. See the chart from the next post I have added cycles.
DeleteThis looks good pattern and cycles - https://ibb.co/fG2RQ2z
ReplyDeleteIf I'm not mistaken Es made an overlap with it's possible wave 2 already this morning?
ReplyDeletethe impulse died long time ago
DeleteRIP
DeleteLMAO Kevin
DeleteIsn't a lower low possible for the 20w low?
ReplyDeleteI think we saw the 20w low already
Deletegap fill on iwm about 229, next dip under 195 she's mine. :)
ReplyDeleteLots of chop & might continue for a few days . Bears want a weekly close below 4462es to get things going .
ReplyDeleteSee what happens later , but my bias is for a rally to get going next week , perhaps from the 4300 area . Most notably , the Dow is still in an uptrend and a test of the early Jan Dow highs is still possible during Feb .
Would like to see an intra day rally today that backs off into the close before a low early next week . The early days of each month seem to set a high or low before a bigger mid month move - just look at recent months .
Looks like an X wave today on futures, expecting Y into next week and then the Krazy Krasi rally.
ReplyDelete