Trading trigger - sell signall, expect something lower for a few weeks.
Analysis - sell the rips, time to get out, potential major top.
P.S. - for a trade both analysis and trigger should point in the same direction.

TECHNICAL PICTURE and ELLIOTT WAVES
Short term - nothing new, still watching the same patterns.

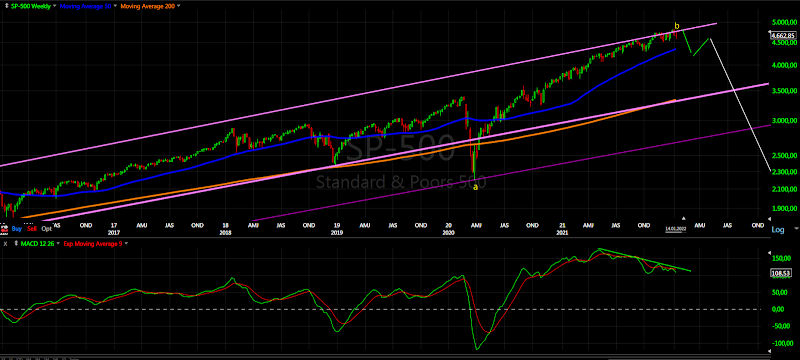
Intermediate term - I see three zig-zags with roughly the same length in time W-x-Y-x-Z or possible W-x-Y with complex double zig-zag for Y.

Long term - topping process running for months and maturing. Some kind of corrective wave b-wave and c-wave will follow. MACD and RSI look very "bullish" - multiple divergences.
MARKET BREADTH INDICATORS
Market Breadth Indicators - no change from last week.
McClellan Oscillator - resetting lower, close to zero.
McClellan Summation Index - buy signall.
Weekly Stochastic of the Summation Index - buy signall.
Bullish Percentage - spike above 70 and turned lower.
Percent of Stocks above MA50 - spike above 75 and turned lower.
Fear Indicator VIX - higher low and divergence.
Advance-Decline Issues - hit ovebought and retracing lower.
HURST CYCLES
Short term cycles - looks like 5w low on Monday and now 20d high in the next days.

Week 15 for the 20w cycle? Looking Market Breadth suprising 20w low early December is possible - this is the case with 18m low on time in July.
Long term I am expecting 4 year cycle high. The 18m low now 50/50 either late September with one extra 20w cycle or alternate on time in June/July... waiting to see how the pattern will play out.

Do you see oil peaking before the indices?
ReplyDeleteNot possible to say at the moment, it could be flat completed earlier or triangle probably peaking with the indices - https://invst.ly/x4toc
DeleteIs 5w low today instead of last week? Would you update your short term counts based on today's move?
ReplyDeleteProbably the one from last week - https://invst.ly/x5nd7
DeleteKrasi,
ReplyDeleteI've been follower of the blog and never took any charts seriously, but I'm realizing now how serious the market crash could be.
The way I see is by March we see nominal ATH and start to grind from there to crash which is led by crash in 30 year bonds and rates abrupt spike to 4%-5% which will be the trigger for this crash.
What would be the tentative time of such crash? sometime in Q2 or Q3 of 2022?
Thx
Usually the c-wave is the crash wave, it is very rare that the a-wave is the big one.
DeleteThe last example 2018-2020 - 2018 a-wave, 2019 b-wave and 2020 c-wave.
If a decline starts with a crash it will burn too fast. So if there is crash statistically it is more likely the c-wave for the 4 year cycle low probably the first half of 2024.
This year we should topping and decline into late 2022 early 2023 for 18 month low then retracement and then a crash if there is such.
Hi Krasi, would it be possible for you to show this possibility on a chart?
DeleteWhere would be the 18 mon high in 2022 for this scenario?
Something like this - https://invst.ly/x6i8l
DeleteThe next 18m high should be in 2023.
So previous 18m high aligns with the recent 4y high?
DeleteThanks Krasi for the chart.
Yes, it is 18m and 4y high at the same time.
Deletebounce from today? or just plain old doom?
ReplyDeleteProbably bounce until FOMC and the n20w low.
Delete