Trading trigger - buy signal. We have the minimum for 10w high 35 days.
Analysis - sell the rips, long topping process.
P.S. - for a trade both analysis and trigger should point in the same direction.

TECHNICAL PICTURE and ELLIOTT WAVES
Short term - a B-wave from a flat or worse another zig-zag of a bigger corrective structure to complete the move from the March low.

Intermediate term - from the March low we have one big zig-zag consisting of two zig-zags, which itself consist of zig-zags. You can call it W-X-Y, but there is no impulses. Testing the broken trend line.

Long term - topping process running for months and maturing. Some kind of b-wave and c-wave will follow.

MARKET BREADTH INDICATORS
Market Breadth Indicators - the same like last week.
McClellan Oscillator - above zero, looks like double top.
McClellan Summation Index - buy signal.
Weekly Stochastic of the Summation Index - buy signal.
Bullish Percentage - moving higher.
Percent of Stocks above MA50 - moving higher.
Fear Indicator VIX - higher low so far... double bottom.
Advance-Decline Issues - lower high so far, looks like topping.
HURST CYCLES
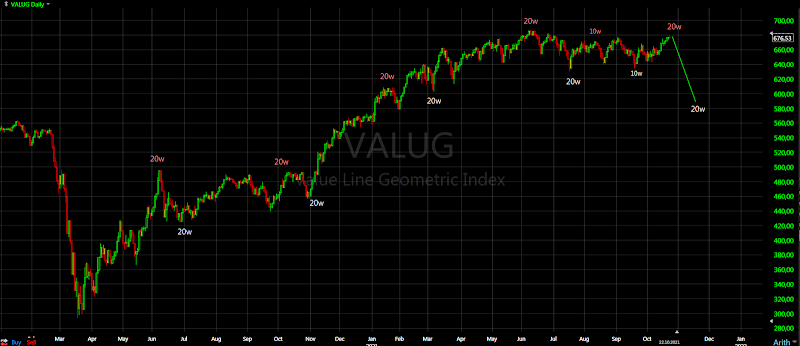
Short term cycles - a few more days were needed to complete 20d cycle high and we have them this week. This should be at least 10w high.

I have shown this chart a few weeks ago - looking at some indices like NYSE,XLF you can make the case that this is 20w high. The outcome should be the same - decline into 20w low. The difference is what happens after that.

This market is nonsense.
ReplyDeleteIt makes perfect sense - big money have to unload huge amounts of money and they need time. That is why a topping process takes time and that is what we are seeing.
DeleteIf big money is unloading, how do indices go up? Shouldn't they decline in this scenario?
DeleteWell technically its a distribution and market can be in a topping range for sure but now this has been like 12 months relentless with minor pullbacks and so how can one differentiate between a topping process and a further grind higher. We have been talking about this since long enough now. In fact we made a higher high again on Friday which is 5% gain in just 7 trading days after falling 5% in 5 weeks. can this be more insane?
DeleteThe bag holders aka retail traders are all in on margin. There were articles on Zerohedge the mot inflows are coming from retail traders.
DeleteYogibear is absolutelly right . I am also tired of this experts that can not predict a single day direction. at least when you are wrong quicklly change the charts . IF you keep predictiong the top sooner or later you will be right :) . Honestlly I am much better then most of the guys with years experience because I do reanalize the picture all the time . Thanks Yogi we need good critics to get results
Deleteinsane is the new sane
ReplyDeleteThe cycle was very clear 1 year ago. Nothing is insane. You guys still haven't figure it out and its clear as day.
Deletelooks more like a third wave of a final fifth as every day passes. Seems like we still need a iv/v to finish it off and the rate they're going , who know where it'll end .
ReplyDeleteThere is a turn date this Friday so will wait & see what happens .
Have not seen clean impulse for years I will not be surprised if this one ends as zig-zag.
DeleteThe last two months look to me like Jan-Feb 2020
test
ReplyDeletetest
ReplyDeletetest successful
DeleteThe pattern is very difficult to count so I was just playing around with XLY and it looks to me like this - https://ibb.co/PYRmSMk
ReplyDeleteThe same for SPX - Z is a flat, the cycle low 20w or even 18m is in July at pattern low as it should be, April was pattern high as predicted. This last move looks more and more like final surge, I think B-wave is dead which is bearish - https://ibb.co/K6HbDRG
As of now I don't see anyone predicting a major decline anymore. Even cycle guys saying it will be a small decline, mostly sideways. Vix saying we're back to normal, rsi says the cliff is approaching.
Deletecould intel be hinting at a massive C wave down from here for tech? https://invst.ly/wf5y7
ReplyDeleteYes
DeleteLol I work for Intel. Intel is having some tough time as reflected in the stock price but it cannot be written off yet. Semiconductor demand is through the roof. If some of the fundamental challenges are resolved, the company has very bright future. I just don't think a massive C wave down can be predicted today.
DeleteLol funnymentals... I will try to summarize it - the world as you know it from the last 100 years is dying. Good luck with your orders they will disappear in seconds.
DeleteI don't disagree that the world as we know it has changed. But I don't understand the demand part. If there are no orders for semiconductors, it means no one is buying phones and laptops, technological development has come to a standstill. What will be the cause for that? Can you elaborate?
DeleteIf oil goes to 250 every company will get hammered to the ground.
DeleteThe whole financial system is broke. 1929 will repeat again... it has started in 2008 and it was postponed - now it is much worse and much bigger. They can not stop it and they do NOT want to stop it.
DeleteAgenda 2030, the great reset and blame it on the c-v-d scam.
They want to destroy everything so that we beg for their utopia - the worst of communism and capitalism.... corporate totalitarian state.
Again it will happen because they ant it.
So I am guessing your recommendation would be to buy gold at some time in the future. What timeline do you estimate for that?
DeleteSometimes in 2024 not now.
DeleteSo you mean we get a bull market top in 2023-24 and not now?
DeleteHow is it possible to predict the years when it will happen so much in advance?
DeleteSo you mean we get a bull market top in 2023-24 and not now? - No, buying gold at that time. The indices are making high now.
DeleteHow is it possible to predict the years when it will happen so much in advance? - Roughly estimation based on cycles. Example - last year everybody screaming buy gold my advice was not to do it because it is 9y cycle high. It worked, now my advice is to wait for the 9y cycle low to buy gold.
Hi Krasi hope all is well. The big question I am struggling with is mid-December a major high or major low ! I have 2 completely opposite scenarios. It is an important inflection point which will clarify the 2022 forecast. We need to be flexible on this one as there is a huge move coming after this. Any feedback is appreciated. Thank you for sharing..
ReplyDeleteAccording to Hurst cycles after mid-December we should see a high the 10w cycle(higher degree possible) roughly every 2 months.
DeleteImportant low is less likely, you have to stretch unnaturally the cycles.
I agree jpnor . There's a myriad of cycles converging the second week of December . But will it be the end of the Sept-Dec correction or is it a cycle high from the March 2020 low ?????
ReplyDeleteI guess it depends on how much of a pullback we get from this high .
First step is below 4515 es .....
major CIT today ....and the market shrugs off the news from apple & Amazon to give us new highs ....
ReplyDelete