Intermediate term view - after it is over correction for a few weeks.
Boring week the pattern looks like bull flag and break out higher in the last hour... finally. In Europe the pattern looks mature I suspect euphoria(vertical move) before the french election creating expectations for a huge gap like two weeks ago... I think the news is already priced in and this is a bull trap. Short term the pattern looks like expanded flat. So close to the previous top I am sure a lot of stops will be hit and then we will see a reversal. Intermediate term VIX printed very low values again without divergence. This makes me think that we are watching iii and iv of 3. This is my primary scenario now and alternate that we have v of 3 and 4. I want to see a multiple divergences on VIX for a sentiment change. The sentiment will change gradually with several higher lows(VIX) before a major reversal. I read somewhere that this is the lowest value since Feb.2007,yes but after that we saw two more higher highs in 2007 before major top 8 months later.
TECHNICAL PICTURE and ELLIOTT WAVES
Short term - The move lower looks like a bull flag and break out. I think we are seeing v of c of B.
Alternate it could be impulse(green) from the March low. In this case this is 3 and we will see 4 and 5.

Intermediate term - Primary scenario is now iv of 3 and alternate wave 4. No need to make a decision now both scenaris are pointing lower for a few weeks. The market will show us what is going on. Wave 4(red) should last longer and move lower to at least MA200.
MACD/RSI ready for a divergence so any move higher should be short living and make an intermediate top.
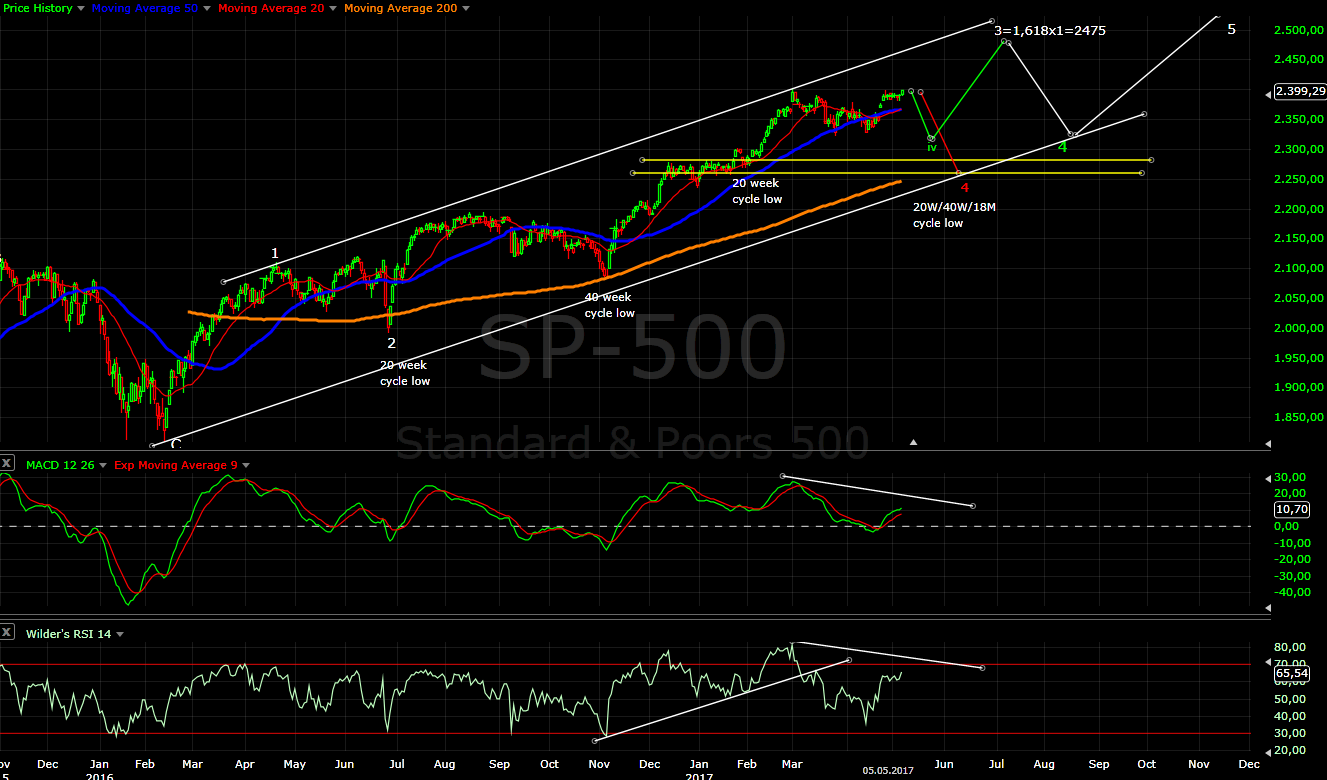
Long term - no change, waiting for the wave from Feb.2016 to be finished.

MARKET BREADTH INDICATORS
The Market Breadth Indicators - not so bullish rather weak, some are turning lower, some with divergences...
McClellan Oscillator - at the zero line.
McClellan Summation Index - neutral... lower high so far.
Weekly Stochastic of the Summation Index - in overbought territory.
Bullish Percentage - technically sell signal with divergence, but it is still above 70.
Percent of Stocks above MA50 - in the middle of the range.
Fear Indicator VIX - spike higher and extreme complacency again... it will not last for long.
HURST CYCLES
Day 28 of the 40 day cycle... already mature and should turn lower soon.

Week 15 of the 20 week cycle and week 64 of the 18 month cycle. Both entered the time window for a low so I expect the indexes to turn lower soon for the 18 month cycle low.

Tom Demark SEQUENTIAL AND COUNTDOWN - this technique spots areas of exhaustion.
Most likely we will see week 12 from a countdown and combo next week, the question is if we will see 13 or not.

No comments:
Post a Comment