Trading cycle - neutral signal. Price and RSI playing with the MAs, but expect at least one more high before thinking about sell signal.

TECHNICAL PICTURE and ELLIOTT WAVES
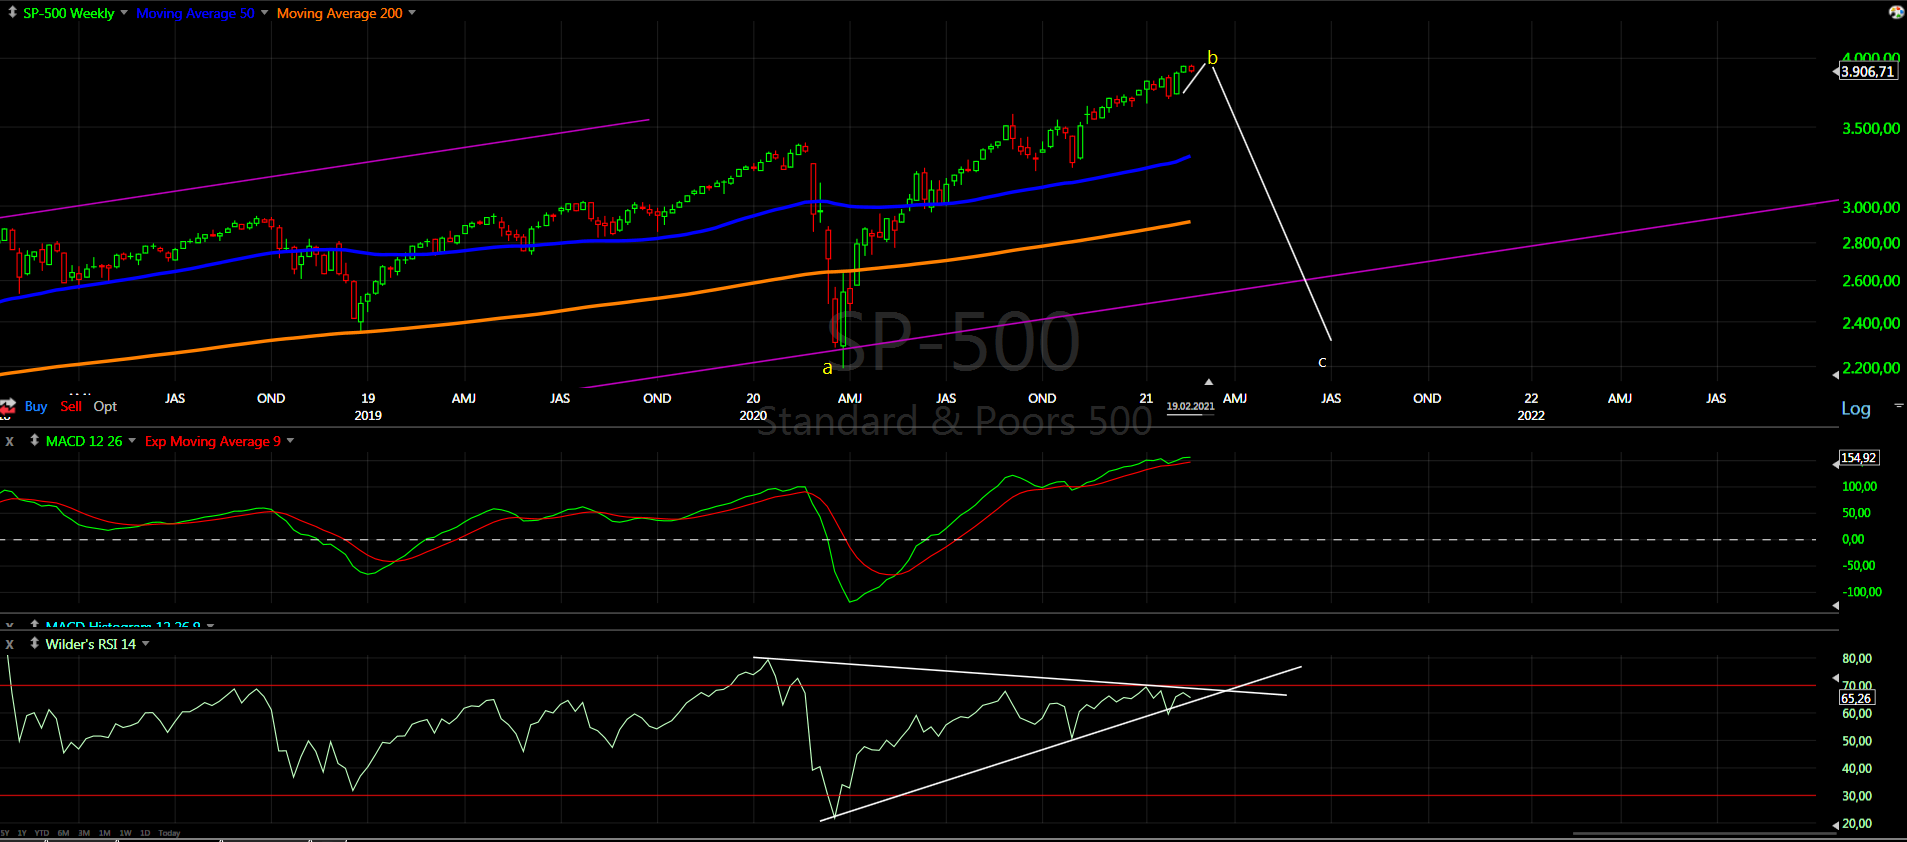
Short term - we have the minimum for corrective b-wave(red the alternate scenario), but for now I will stick to the plan a few more days probably triangle before the next move up.

Intermediate term - I see one big zig-zag up. You can count it as W-X-Y(white) classic EW, but we do not have impulses. More likely series of zig-zags A-B-C(yellow) with the C-wave as a diametric.
Pullback b-wave running, the final zig-zag should begin soon.

Long term - the bull market completed in 2018. Since then a bunch of corrective waves. Currently I think this rally should be a corrective wave of a bigger pattern most likely triangle. Look at NDX we have corrective wave which is 1,618 bigger than the previous one which could be only b of a triangle. I think the best looking pattern is Neely's triangle.
MARKET BREADTH INDICATORS
Market Breadth Indicators - showing weakness and lower highs so far.
McClellan Oscillator - below zero.
McClellan Summation Index - buy signal.
Weekly Stochastic of the Summation Index - buy signal.
Bullish Percentage - around overbought level 70.
Percent of Stocks above MA50 - below 75.
Fear Indicator VIX - around the lows.
Advance-Decline Issues - around the middle of the range.
HURST CYCLES
Short term cycles - ideally a few more days lower for 5w low then higher.
If next week is up than I would say 20d low with length 13/14 days. We have a new 20w cycle which could have different rhythm... too early to say. This will not be a surprise - the previous one was very short only 13 weeks so the current one should be longer like 18-20 weeks. See the previous 40w cycle - 14+18 weeks and the 20d cycles 15-14-12 days length.

Week 3 for the 20 week cycle. Again looking at the high-to-high count - several weeks ago I wrote that I see three 10w cycles with length 7 weeks and promptly three and a half weeks later we have 5w high... so another three weeks, the alternate scenario one week.

You need a long bond chart Krasi . Looks like an ending pattern there , but if they continue to spike lower next week , S&P could suffer a big breakdown for your end of Feb low ....certainly going to be a big week
ReplyDeleteBonds should be at 18 month low and should move higher for a few months into 18 month high.
DeleteIt correlates with indices which should be close to a high and move lower for a few months.
Hi Krasi, you usually don't mention 9y cycles. I just watched YouTube video from SentientTrader on Hurst cycles and one of the two scenarios closely matches your analysis though David talks about 9 year cycle low and whether it was in 2020 or happening later in the future. What do you think about that cycle?
ReplyDeleteIt is usually 7,5-8 years long and I count it from 2009 with the next one in 2024.
DeleteSome count 2002-2011-2020 I do not think this is right.
http://practicaltechnicalanalysis.blogspot.com/2020/03/weekly-preview_28.html
ReplyDeleteThe difference in your chart from March 2020 to today is amazing. If you missed this run like the one in 2019 you really shouldnt be trading. I'm not talking about Krasi here. I'm talking about people who sit on the sidelines for the last two years outta fear thinking the market was gonna crash.
Pretty much everyone I followed had that chart. People thought that if SPX rallied, it would be the last chance to get out.
DeleteNeely was one of the few who called ATHs in early April.
But now he's been calling an imminent top for months. Nobody foresaw that all of the stimulus and QE would result in a bubble.
But we did have a crash in March. The FED just printed 6 trillions to stop the bear market.
At the end of the day, just buy what you believe in. Nobody knows what will happen.
I mean there is something seriously wrong with EW. That long term chart from March 2020 is over 1000 points off. Basically EW just keeps moving the number up. First it's 3K high. Then it's 3200 then a drop, then 3500, then 3700, then 4K, then 4100, then 4500. At some point it drops then it's look I was right. This is like people who predict doom every year then an earthquake happens 10 years later and they pull the I told you so. Fucking stupid. The drop in 2020 had to do with the high in Sept 2018 and the low in Dec 18. Basically to be in EW you need to draw lines on charts, throw in some Fibs and keep redrawing until your right. No accountability. They really should drop the word theory. Theory needs to be (a) substantiated, (b) explanatory, (c) predictive, and (d) testable. When you change the data weekly for over a year to finally get an outcome (after it's completed) I'm sorry but that's not a theory.
ReplyDeleteWell friend, this is a free blog and Krasi is not asking anyone to follow his advice. Any serious trader/investor does their own analysis and takes responsibility for their decesions. EW is just a system like many others. Figure out what works for you.
DeleteI have to chime in here in response to the comments above. I don't understand people's expectations when it comes to market analysis and the methods employed to predict market moves. Here's a news flash: NO METHOD IS PREDICTIVE. None. Those that are right simply guessed properly. That goes for elliot wave, classical charting, fundamental analysis, macro analysis, sentiment, etc. Those pointing to charts from March and saying "see elliot wave couldn't predict prices a year out!" are totally missing the point of the analysis.
ReplyDeleteAny type of methodology is simply a framework that hashes out the possibilities and probabilities. That helps set your expectations and positioning. As the market evolves the possibilities and probabilities evolve with the market. But, YOU TRADE THE PRICE. This is why Krasi starts with a brief trading section. Predicting where the market will be and actually trading it are two separate endeavors. They are related but if you trade predictions only you are going to be disappointed.
If you expect any blogger or newsletter writer to be totally predictive you are barking up the wrong tree. There is no crystal ball. Those that are right guessed properly. That's it.
Listen to some of the greats and how they approach the markets Soros, Druckenmiller, Tuder Jones, etc. They all approach it the same way and change their minds constantly. They have expectations, adjust them with new incoming data, and trade price.
I get what your saying but try explaining that to an EW guy. They will just call you stupid, sheep, etc. They called all the tops/drops and everyone else was too stupid to see it. I have heard it from all of them.
ReplyDeleteDefinitely close to a top - another useless rant, just another guy which has no clue how to use EW.
ReplyDeleteHonestly I am tired to listen the same bullshit over and over and I will not waste my time to explain.
When EW is such shit share your analysis - where and when is the top and the coming bottom?
All "experts" like you have big mouth, a lot of critics and zero analysis. It is easy to criticize show me alternative, something better?
P.S. this chart from March is based on cycles not EW. Cycles failed with missing two months not EW. I have tried to fit EW to time and this was wrong.
this move has been a corrective b wave/x wave. these moves are notoriously hard to predict
ReplyDeleteAs per my Feb 9 comment as of Friday I am now two thirds short SPX ....waiting for MACD break of signal line to add final short ( could be today) . I know what my stops are so low risk of losing too much ( currently in the money). Its all about probabilities and managing your risk....and Krasi's work is an important part of that for me.
ReplyDeleteand if I lose money its nobodys fault but mine.....
ReplyDeleteInteresting stuff Krasi. Keep it up. Definitely appreciated here.
ReplyDeleteonly bonds matter this week . S&P support around 3835/40 - if that goes , we should fall another 100pts asap .
ReplyDeletethe "one more high" scenario looking more doubtful . Could be lower highs ahead for a while with 5 up complete
Double zig-zag and 50% retracement if this is b-wave it should be completed. More to the downside will be very questionable.
ReplyDeleteThat is extremely accurate, Krasi. What would be the next move?
DeleteIn theory 2 weeks up with slightly higher high.
DeleteThat looks less than 50% odds to me . There is a cycle low due this weekend , so I think you will need a double bottom around 3800 to give another leg up . Or maybe it was 3/4 days early ..but unlikely
DeleteSlightly higher odds the low goes to 3740 or below I reckon and we have lower highs ahead .
I shorted silver, if it's finished with it's cycle, should be a mammoth C drop.
ReplyDeleteThe arrive to the down canal, every thing is OK, nothing happened
ReplyDeleteKrasi, what do you say about Sid nuris?
ReplyDeleteFrom Eliot wave plus
I do not know, I do not follow him.
DeleteWatched him many years ago - not really impressed just another mediocre EW guy.
Hi Krasi given the weakness in NDX, do you think rally can continue for ~2 more weeks? It looks like NDX has already broken down from the upward trend.
ReplyDeleteOn the other side DJ and NYSE with sideways corrections as expected... it is a guess now we can only wait an watch the pattern and the indicators.
DeleteEEM probably topped on 16th February (H&S in the making?) which means top in developed markets in March.
DeleteLast time not all indices made higher high, probably the same this time too.
DeleteKrasi, I'm curious. During the last major downturn (March 2020) UVXY increased almost 10x. You indicated this time around you plan on using 3x ETF's. Even if S&P goes down 30%, the best you can do is double your money. Why do you prefer the inverse 3x ETF's? Thank you.
ReplyDeleteI do not prefer inverse ETFs I prefer triple ETFs the direction does not matter. I am not buy and hold guy... months is ok but not years so 3xETF is ok.
DeleteOf course the long trade is much more profitable because to the downside the maximum is 100%.
All ETF compound daily, so for 3xInverse, for let's say 5 down days -5% each will equal to:
Delete1day: 15% gain
2day: 15% gain on top of 15% gain = 32.25% gain
3day: 15% gain on top of 15% gain on top of 15% gain = 52.1% gain
4day: 15% gain on top of 15% gain on top of 15% gain on top of 15% gain = 75.0% gain
5day: 15% gain on top of 15% gain on top of 15% gain on top of 15% gain = 101.1% gain
But this is double edge sword, if for example daily gain in underlaying is substantial, it is game over for leverage inverse ETF, i.e. daily gain of 30% in underlaying for 3xinverse ETF=-90% so underlying would have to triple to be breakeven
regards,
Mily
Yes... this is typical for some commodities or volatility. You have to know what you are doing.
DeleteFor indices is rare to see 5% days not mention 30% days.
Tuesday was 5 week low?
ReplyDeleteIt seems so.
DeleteDo you still think TLT is close to a bottom? What is the upside target?
ReplyDeleteTime is time it has not changed. I do not know, I do not have any target.
DeleteI do not follow bonds closely just watching time for important low high.
All about bonds this week . The long bond looking very perilous now and if technical selling pushes that to extremes over the next few days , there is a chance of a much bigger nq/es rout .
ReplyDeleteStill looking for a low friday/monday
Do we have reversal?
ReplyDeleteToo early to say. We need to see the close and what happens tomorrow.
DeleteHi Krasi, do you think USD is ready to reverse and go higher?
ReplyDeleteYes, it looks like weak corrective retracement.
DeleteEveryone is clueless, nobody has done a good job of predicting the short-term tops of this move. This could go higher until Summer. Eventually you will be right.
ReplyDeleteIf we drop to 3700 then rally this will extend the move for another three months.
Deletethe bigger the drop, the stronger itll come back?
DeleteI doubt this is the top. We may just make another low in the next few days to weeks then rally for the next 3 months confusing everyone.
DeleteNasdaq has broken it's channel and everyone still thinks this will be a minor correction. ok
DeleteBonds have been the tell all week - as posted in the first message of the week .
ReplyDeleteWaiting to see if 3800 goes today and if so , whether the low will be in the 3740 area or at extremis 3650/60 on Monday .Easy money will be made if it goes to plan - might be volatile & whippy for a few more months then .
Best case now is any rally into May/June is a double top or marginal new high in some indices .
There is no another three months up.... where is this idea coming from????
ReplyDelete