Intermediate term view - not sure important top in 2-3 weeks or more upside in the next 2 months.
I was expecting to see some pullback and continuation higher... nothing similar just moving vertically higher. That is in fact worse for the bulls. Such moves are not sustainable. I think now the chance is much higher that we are close to an important top... If the correction was like in 2010 or 2011 long enough I would say new longterm move higher has started, but now after two years rally I doubt it. It feels more like August-October 2007.
The two scenarios which I see is a top in the next two weeks or the expanded flat(less and less probable). In both cases I expect the current move to start topping which will last 1-2 weeks. We will sew a new ATH something like 2030-2040 to trap the herd. Than a move lower should follow. In the case of an expanded flat it should be a 3 wave corrective structure and bottom above ~1925 which is support and 50% Fibo. Cycles are still "young" and market breadth is positive showing strength, so it should take some time 2-3 weeks before any reversal occurs.
TECHNICAL PICTURE
Short term - it should look something like this the short term.... some up and down moves so that the current move decelerate and reverse.

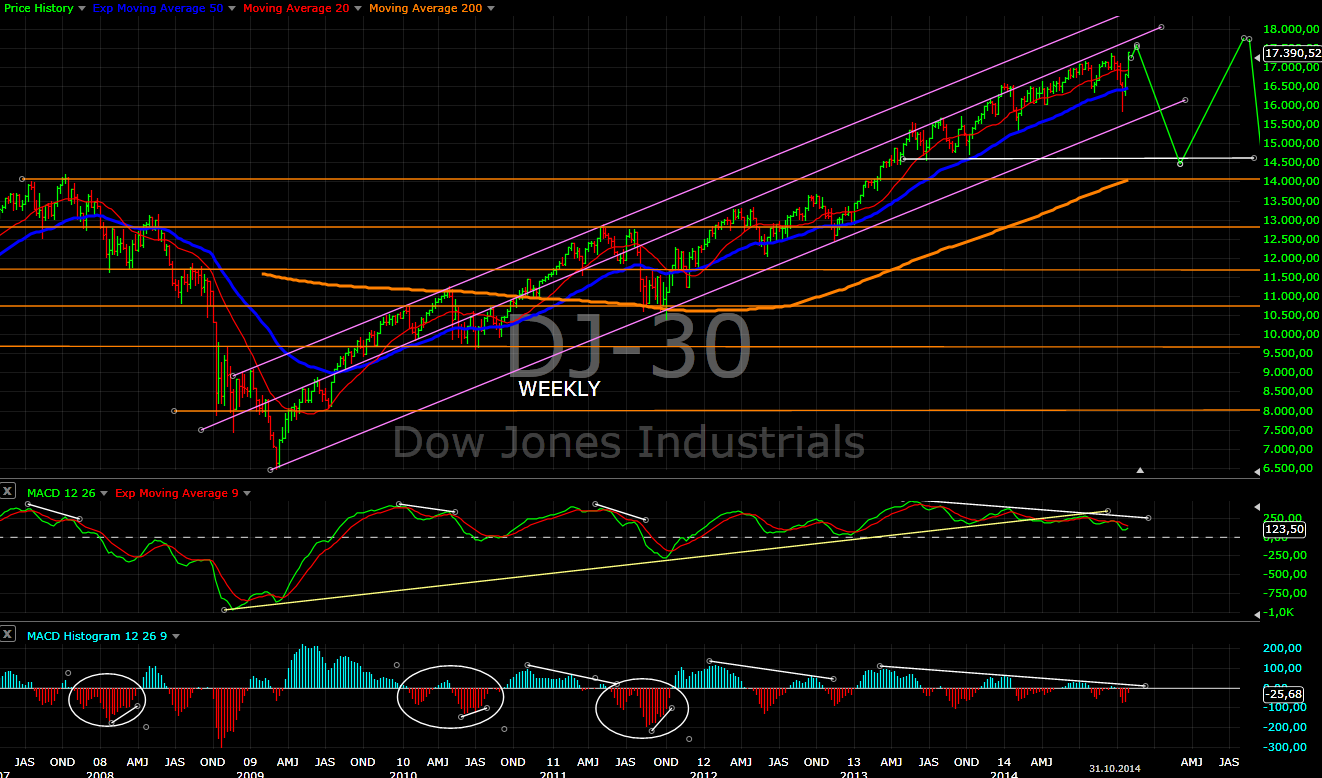
Intermediate term - the histogram(and many other indicators) hit very overbought levels. Usually this is a sign for a strength and than you wait for a second peak and divergence before a move in the opposite direction. Look at the price action and the indicator where I marked it with a green arrow. So even if this is an important top and you are a bear just have patience and wait for a while.

Long term - the long term picture is unchanged.
MARKET BREADTH INDICATORS
The Market Breadth Indicators - is positive and shows strength. Nothing to suggest a reversal at the moment.
McClellan Oscillator - several higher highs in overbought territory. Strength and no signs of a weakness. Cool off expected.
McClellan Summation Index - buy signal.
Weekly Stochastic of the Summation Index - buy signal.
Bullish Percentage - buy signal
Percent of Stocks above MA50 - buy signal, near to the 75 level.
Fear Indicator VIX - moving lower. I expect another higher low after the current move higher is over.
Advance-Decline Issues - in overbought territory. This should be a sign for a strength and not a reversal... rather cool off.
NYSE New Highs-New Lows - sharp reversal and in overbought territory.
HURST CYCLES
Day 11 of the current 40 day cycle.It will take some time before it topes out.

Given the strength there is a high probability that this was a 40 week cycle low. The length is the average expected for this cycle. The unusual is that it consist of three shorter than the average 20 week cycles.

Tom Demark SEQUENTIAL AND COUNTDOWN - this technique spots areas of exhaustion.
Nothing interesting... the setup was finished as expected. With the very high volatility there is no edge on the daily or weekly chart to use Tom Demark sequential.

No comments:
Post a Comment