Intermediate term view - pullback after a short term top and another move higher.
Nothing new, just the charts updated. Now everything looks ready for a move lower - bearish candles, divergences histogram/RSI/slow stochastic on different indexes(best visible on Russell200), market breadth, cycles at day 31 from 40 day cycle, TomDemark countdown completed..... only a pullback next week is missing:)
Anyway I think the idea to take some profits this week was not a bad idea at all.
TECHNICAL PICTURE
Short term - the first move lower should find support around 2040 followed by a lower high and than lower again to at least 23,6% Fibo retracement.

Intermediate term - waiting for a short term top and to see how the move lower will look like. Targets for the pullback the previous high and MA50

Long term - the long term picture is unchanged.

MARKET BREADTH INDICATORS
The Market Breadth Indicators - a lot of divergences.... long term indicators are still rising, but a pullback is due.
McClellan Oscillator - lower high and divergence.
McClellan Summation Index - buy signal.
Weekly Stochastic of the Summation Index - buy signal, but in overbought territory.
Bullish Percentage - buy signal.
Percent of Stocks above MA50 - buy signal... pullback overdue after hitting overbought levels.
Fear Indicator VIX - another higher low.
Advance-Decline Issues - lower high.
NYSE New Highs-New Lows - lower high and divergence.
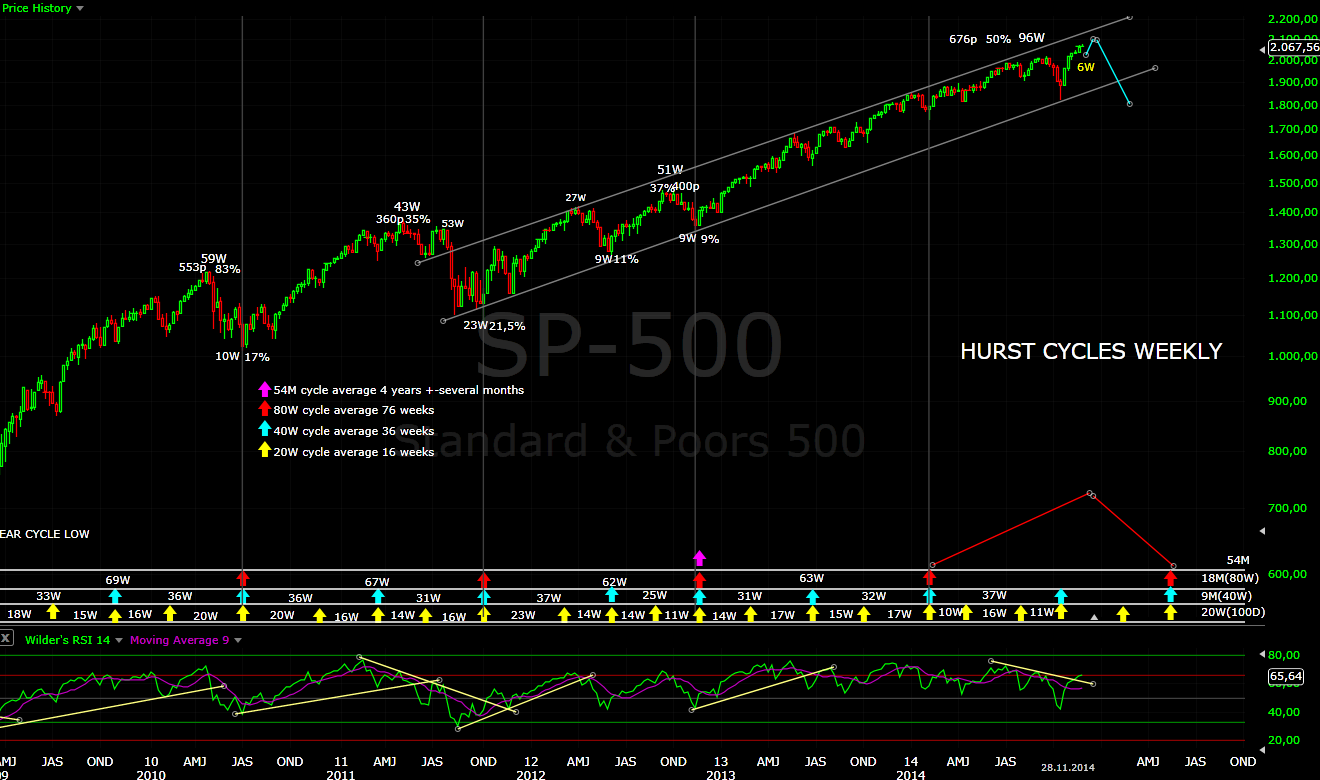
HURST CYCLES
Day 31 of the current 40 day cycle. I think next week we should see a move lower.

Week 6 of the current 20 week and 40 week cycle.
Tom Demark SEQUENTIAL AND COUNTDOWN - this technique spots areas of exhaustion.
The countdown is completed. Now if we see a move lower it will be perfect:)

No comments:
Post a Comment