Short term view - more downside expected to finish this move lower.
Intermediate term view - when the short term moves finish I expect a correction for 2-3 weeks.
My assumption that we saw an exhaustion was right... no RSI and the statistic was right:) Now you know that the index can move lower too:)))
Current thoughts:
- the move lower is corrective, but it does not look finished.
- FOMC 18.06... expect a bottom or a top for some of the short term moves from the first chart. I do not know, we will see how fast the indexes are moving on Monday/Tuesday
- RSI hitting overbought level usually means two things - strength and expect profit taking. We saw exactly this... Strength means the top will be tested or exceeded. See the post Statistic and the marks "2" - the reversal comes a little bit later and not when we see overbought levels.
Based on this observation my best guess projection is shown on the first chart. I think we saw wave A down, currently B is running(top FOMC?) and wave C lower should follow(bottom FOMC? if the indexes move very fast)
RSI statistic and the corrective structure to the downside argue that after that we should see a marginal new high before intermediate term correction.
TECHNICAL PICTURE
Short term - the short term is difficult to predict especially corrective moves... so you should follow closely the price action next week if you want to trade. At the moment I think the move will look perfect if we see one more leg lower to 1910 - the trend line, 50% Fibo, A=C.
Intermediate term - no change... correction to the trend line and support expected.
Long term - I do not think that any move higher will clear the MACD divergence and start another long lasting rally. I think the next big move will be lower, but it could last months until we reach this point.
Do not fall asleep, double MACD divergence on the weekly chart means expect something nasty...
MARKET BREADTH INDICATORS
The Market Breadth Indicators - still on buy, but look tired... intermediate term top is near as I expect?
McClellan Oscillator - moved bellow zero...
McClellan Summation Index - buy signal, but turned lower. Still lower high.
Weekly Stochastic of the Summation Index - buy signal, but reached overbought territory - time for an intermediate term top?
Bullish Percentage - buy signal, but with long term divergences.
Percent of Stocks above MA50 - pulled back from overbought territory...
Fear Indicator VIX - jumped higher from very low level...
Advance-Decline Issues - very weak since the last top.... the indexes are moving higher but the advancing issues can not move to overbought territory.
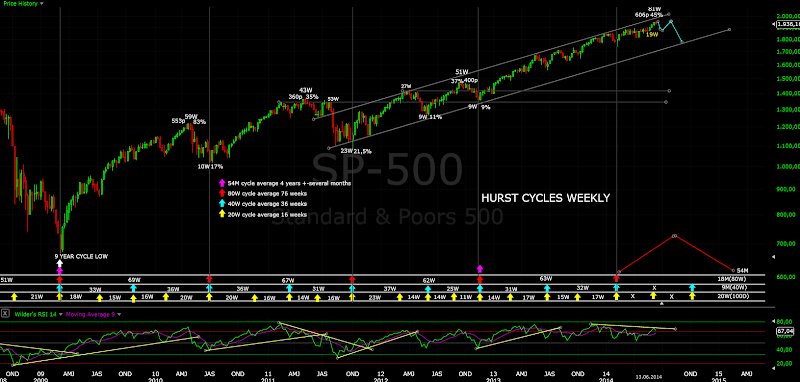
HURST CYCLES
Day 43 there is high probability that we saw the top of the 40 and 80 day cycle.
Waiting for a correction to finish the 20 week cycle.... The cycle will be right translated that is why I do not expect an important top rather a new high after the low.
Tom Demark SEQUENTIAL AND COUNTDOWN - this technique spots areas of exhaustion.
The combo and sell setup on the weekly chart (almost finished) say we should expect correction soon. Marginal new high will fit perfect.
Very high probability that the sell setup will be finished.
Subscribe to:
Post Comments (Atom)


No comments:
Post a Comment