Intermediate term view - waiting for a bottom followed by a rally in November.
Another very choppy week.... again nothing interesting and waste of time, but I have one idea which looks good. In the comments I was asked if wave lower is already running. For a few weeks I think that we have stealth 40 week cycle low in September (the 50 points plunge) and wave 2 lower is running. Why? - First overlapping waves, for DJ we have already overlapping between supposed wave 1 and 4. Second because of cycles - since the 2009 low I have not seen two longer 20 week cycles in a row in one 40 week cycle. Usually you have one longer and one shorter cycle and you have 40 week cycle with average size. The problem is that the move lower definitely consists of corrective waves. You do not need to be expert to see the mess we have. I was thinking about diagonal lower, but the second low was just slightly lower with a long shadow.... I thought maybe a triangle. Than again in comments someone pointed out that descending triangle is a bearish pattern and I have looked yesterday NYSE chart... now I think the "triangle" is in fact diagonal (see the NYSE chart). The alternate scenario is because of the "political drama" in the US, the market becomes nervous and we see a spike lower to cause fear before a bottom.
TECHNICAL PICTURE and ELLIOTT WAVES
Short term - closer look of the patterns. The more bearish pattern (red zig-zag) does not count very good and does not make sense. It is bullish (bull flag), but it will overlap with the previous wave higher which is bearish.... where is the impulse and the bullish pattern????
Short term it is difficult to say if the indexes will continue lower and make a low on Wednesday(FOMC) or bounce higher(FOMC) and make a low around the elections. With the rally from the low on Friday the second option looks better.

Intermediate term - I would like to see the wedge to overshoot a little bit and overlap with the top of the first wave higher at 2110. This will confirm that the wave higher is finished.

Long term - RSI looks to support the idea that a wave lower is already running.... worst case slightly higher high with divergence.

MARKET BREADTH INDICATORS
The Market Breadth Indicators - the message I see is that we are nearing a bottom.
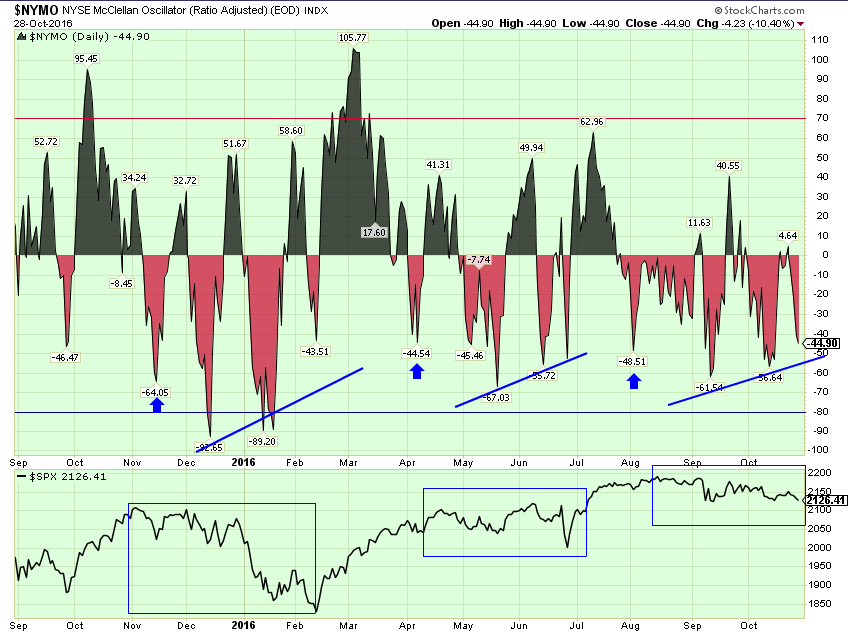
McClellan Oscillator - multiple divergences.
McClellan Summation Index - sell signal, nearing zero.
Weekly Stochastic of the Summation Index - sell signal, oversold levels for weeks.
Bullish Percentage - sell signal, close to a level where a correction bottoms.
Percent of Stocks above MA50 - slightly above the oversold level, ready for a divergence?
Fear Indicator VIX - some fear and level like 20 will be good for a low. I think it has started building divergences for an intermediate term top.
Advance-Decline Issues - in the middle of the range.
HURST CYCLES
You can see that from the 2009 bottom there is no single 40 week cycle consisting of long+long 20 week cycle (average is 14-16 weeks length). The pattern is usually long+short(something like 19+12 weeks) or long+average(20+14) or average+average(14+16). You need shorter cycle because the length of the 9 year cycle is 7 years.
That is why I think we have stealth 40 week cycle low in September and this is the first 40 day cycle of the next 20/40 week cycle.
Now we wait for a confirmation - a rally making lower high.

NYSE - it looks like clear pattern to me.... diagonal lower.

McClellan Oscillator - compare with the previous corrections. The indicator is spending several months in the red area(below zero), the first trough (the arrow) says correction is around the corner, than we have another three troughs with divergence.
It will be very very unusual if the move lower just continue for another month or two without a retracement first and reset of the indicators from oversold levels.
Thank you Krasi for the detailed analysis!
ReplyDeleteI have one question for you:
In your long term view, it seems like you are seeing a ending diagonal for wave5 (which started after the big drop of Jan2016). What is we are in a wave4 and that we just completed the B wave of that correction and have started a drop (wave C). any reason such a count would be invalid in your opinion
--Jules
I know many are watching this pattern. I do not like it.
DeleteIt is neither diagonal (w4 taking way too long) nor expanding diagonal (w1 way too long).
I think it is too early for a major top of the 7 year cycle.
I think the technical indicators are resetting not topping.
We will know until the end of the year, but I do not think that this is a major top.
Krasi,
ReplyDeleteWhat is your method for analyzing natural gas? The peaks are very difficult to sort out for me.
Thanks
Kali
Like everything TA+EW+cycles. So far I was using only TA+EW, but now I have added cycles. For example I have traded the last peak only based on TA+EW I saw the post of SilentOne later - 5 waves from the low in March, 5 waves for the fifth wave, divergences MACD/RSI on the weekly chart, buying climax 4% with overthrow of the wedge(diagonal last wave 5) and I bought DGAZ at this overthrow. The signs were for important top and cycles just confirmed it.
DeleteNatgas cycles counting bottom-to-bottom look consistent for shorter periods 25 days->50 days->18-20 weeks, but for longer time frame the pattern is missing.
Counting top-to-top and the cycle is working like a clock every 2 years and 8 months(02.2003/12.2005/07.2008/06.2011/02.2014/10.2016) and when you combine them in bigger cycles 5,5 and 11 years.
Now I am adding cycles analysis top-to-top and bottom-to-bottom for everything.
For commodities top-to-top works better for stocks bottom-to-bottom, but if you use both you have better picture when to expect important low/high.
Thanks Krasi.
ReplyDeleteAlways appreciate your insight.
Looks like bottom may come early before the elections!!
Kali
I think the bottom will be tested around the elections.
DeleteMore likely slightly lower low with divergences than higher low, but first we have to see this bounce higher.
I will try to buy at 2088 for a quick bounce to MA50...is that what your chart implies near term? Or do you see a better chance it continues closer to 200 day MA and 61.8% retracement from June low to Aug high.
ReplyDeleteYes, that is what I mean. The indexes are near to a bottom... probably slightly lower low with divergence. After that a rally higher, but I do not think we will see a new ATH.
DeleteQuick... a few weeks 2-3 at least, corrective three legs higher.
I see head and shoulders now from mid-Oct
ReplyDeleteYes, it is possible on the hourly chart I see something similar from 13th of October
DeleteHey Krasi,
ReplyDeleteGreat work. Do you see gold reaching 1300 before reversing to 1220/1200 ?
I'm thinking about establishing usd longs again.
Thank you.
Gold is already at 1300. It should move higher for 2 months, 1200 should come next year.
DeleteCareful with USD there is high probability that wave E lower of the triangle is already running.
Krasi,
ReplyDeleteWhat is your take on the low to be tested if trump is elected. Any thoughts on the subsequent moves? I find current scenario harder to evaluate than breexit considering the market seems to be already pricing for potential trump victory.
Thanks,
Kali
The pattern looks like "we are scared because Trump wins", but H.Clinton gets elected and relief rally follows.
DeleteThis is the only pattern which makes sense watching market breadth,cycles and EW.
If Trump wins... probably the same like Brexit - the market plunging lower and reversal with rally higher. The pattern will look uglier with the bottom lower, but at the end it will be the same wave A of 2.
Thanks !
Delete- kali