Trading cycle - buy signal. The high-to-high cycle is mature for a top and waiting when it will reverse for the real down part of the fourth daily cycle... maybe test of MA10 next week and final high.

TECHNICAL PICTURE and ELLIOTT WAVES
Short term - from the March low all moves are zig-zags... that is why I want to see final c wave and another zig-zag for completed pattern. For perfect alternation of the zig-zags in the Z pattern we should see c=0,618xa. It looks like a flat for b/b, on Monday we will have more clarity alternate c/Z is already running.

Intermediate term - zig-zags building bigger zig-zags, there is no impulses. From orthodox EW perspective is triple combination W-X-Y-X-Z, but there is no impulses. So if you stick strictly to the theory you need something else like neowaves patterns diametric/symmetrical. According comments G.Neely sees symmetrical with lower high for i(red count) - example. I will not be surprised, it will fit perfect:
- from TA perspective it is complex H&S top and we will see the price playing around with the MAs before the real decline.
- from cycle perspective it is this wobble caused by the coming 10w low(see weekly cycle chart).
- it will burn time which is necessary - if we see the big decline starting now it will take too long until March and fear does not take so long to discharge.
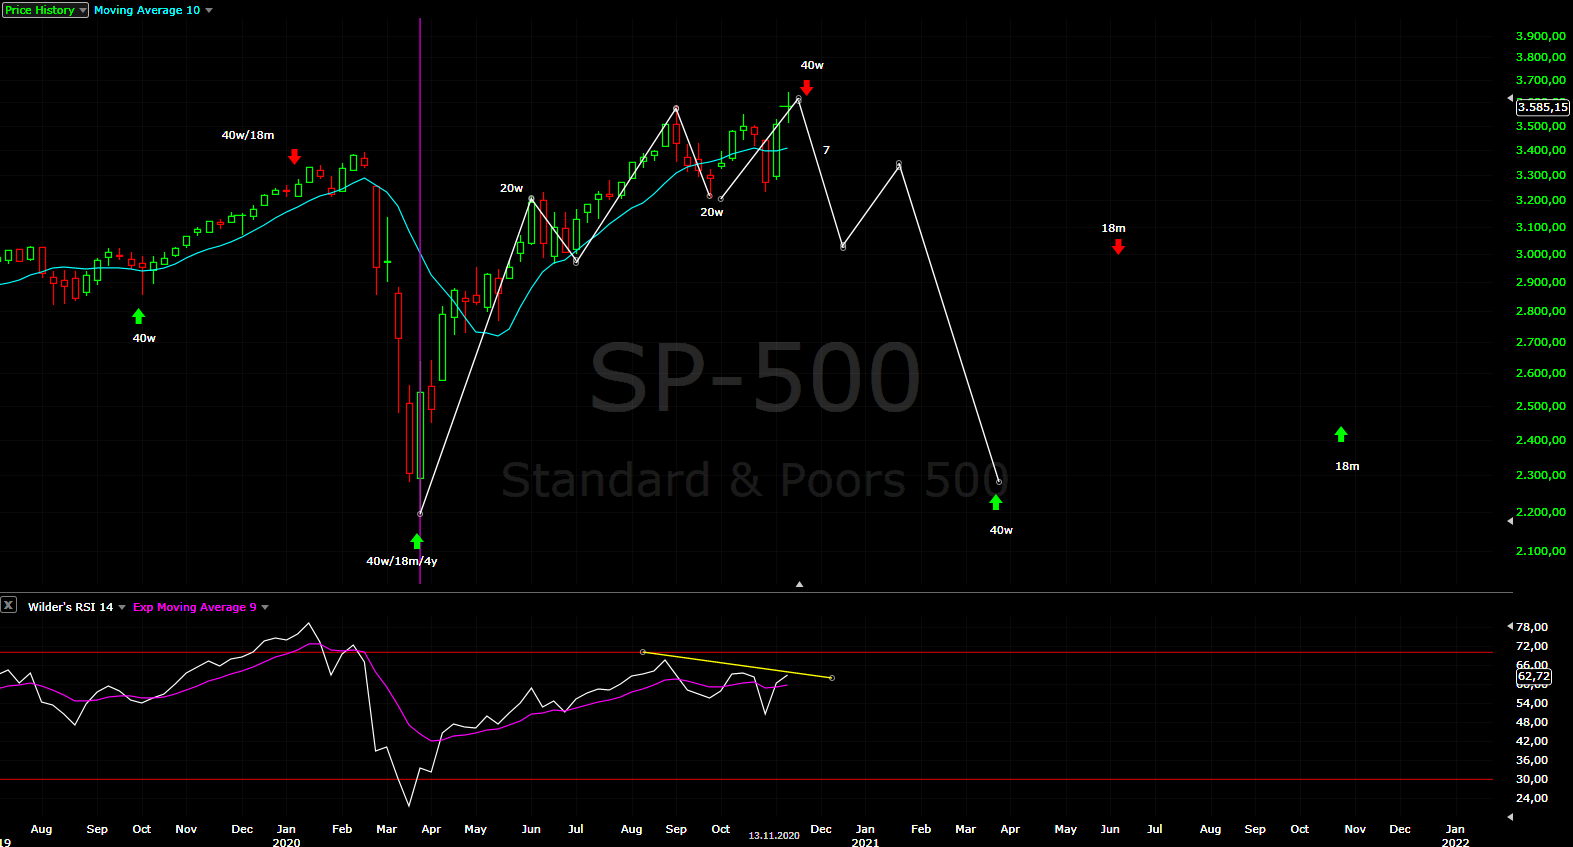
MACD shows clear double divergence between the three highs - just an info for those who dream that this is continuation.

Long term - the bull market completed in 2018. Since then a bunch of corrective waves. Currently I think this rally should be a corrective wave of a bigger pattern most likely triangle. Look at NDX we have corrective wave which is 1,618 bigger than the previous one which could be only b of a triangle. I think the best looking pattern is Neely's triangle.
The indices are close to price high and turn lower. The indicators are pointing to topping not continuation. The weekly candle telling the same no continuation after the big green candle from last week.

MARKET BREADTH INDICATORS
Market Breadth Indicators - overbought some with divergences, it will be perfect if we see the oscillators with short term divergences too.
McClellan Oscillator - lower highs.
McClellan Summation Index - buy signal with divergences.
Weekly Stochastic of the Summation Index - sell signal.
Bullish Percentage - overbought level.
Percent of Stocks above MA50 - overbought level.
Fear Indicator VIX - higher low.
Advance-Decline Issues - overbought, lower high and divergence.
HURST CYCLES
Short term cycles - the last three 5w cycles are counting better if you dived them in three not two. I see 10+10+8=28 5w high, 8+9+9=26 5w low and so far 9+11+4=24 for 5w high. So we should see a low soon and a few days higher to complete at least 5w/10w high and with high probability 40w high.

Week 7 for the 20w cycle. The indices are close to 40w cycle high.
thanks for referencing glenn neely and neowave. i was not aware of him. i disagree with his forecast for the larger leg down.
ReplyDeleteThis 40w high takes way too long.... it feels wrong. If we do not see a top next week I would say cycles count better like this - https://imgur.com/a/Uvh3ggG
ReplyDeleteEven now this is the better count, otherwise I can not explain the DAX price action.
Krasi, with vaccines and the Corona situation likely to get resolved over the next 2-3 quarters, one would have imagined SPX going to 4K+. But that scenario doesn't show up in this alternate scenario as well. I understand that news don't matter but curious to know your thoughts on why SPX doesn't go to much higher levels from here. Wouldn't people be less fearful going forward?
ReplyDeleteBecause the pattern is corrective with divergences.
DeleteI can imagine a higher high if this is an ABC structure, so far it feels like it on /ES. https://invst.ly/sub35
ReplyDelete3460 looks more reasonable for a possible C https://invst.ly/sub3k
DeleteIf the end game is this week or early next from a timing perspective , then the lesson of the last few years is that the market will not give another pullback but will just grind its way towards the target .
ReplyDeleteRecent experience should also tell us that it will go much higher than the bears can stomach .
If today's gap up sticks , this could be a bullish week .
I have the feeling that the timing is different, that is why I have posted alternative cycle chart.
DeleteI think this week will be lower instead of a top, which will make the cycles much longer and the pattern is the same, but stretched in time.
Notice/Update sent yesterday per Neely. FYI
Delete"NOTICE: Until this week, the NEoWave Trading service produced a long string of positive return months. This week's unexpected "hyper rally" changed things and forced us to cut losses quickly on some positions to protect capital. If you get my forecasting service, you know NW structure has been warning since mid-October a major market top could be forming. While that remains the possible, it's important to understand the BIG difference between forecasting and trading. If you trade as if your forecasts are never wrong, you and your money will soon part ways. Until NW can CONFIRM a major top has occurred, our best path forward is to maximize options premium collection. The minute NW confirms on monthly S&P charts that THE TOP is in, we will stop our bi-polar strategy and focus on put spreads and naked put positions for months."
interesting
DeleteIt's odd to me that in the 10/15 video he seemed to prefer a scenario where the final g-wave (of the diametric he was forecasting at the time) had a blow-off up to 3750 to suck everyone in after the election - https://i.imgur.com/9ZCcZ0B.png
DeleteI would have thought his active positions would have reflected that possibility.
I'm still confused why he switched to symmetric or why it even matters... if the i-wave ends up being a lower high then for practical purposes the g-wave is still the tradeable high.
According to RSI we might be there, looks like end of the road for SPX from the March low - https://imgur.com/a/AO1ex6v
I have the feeling this is not the top and we will see it the first week of December.
DeleteThis is based on cycles. We can only wait and see how the next move lower develops.
Electorates vote Dec 14...
DeleteFight far from over i think though media says it is.. completely ignoring recount.. sonething is still fishy imo..
Thanks Krasi ,if no meaningful pullback , there is a 6 week cycle suggesting a high around Friday/Monday . Maybe a spike on the Brexit deal for a full house of optimism ...
ReplyDeleteShort term another guess for the b wave, fits perfect with my expectations for a pullback until Thanksgiving - https://invst.ly/sv3m5
ReplyDeleteI am not an expert in neowave patterns, but if the top is this week, watch this - https://invst.ly/svf0z
DeleteDiametric g to complete G of a bigger pattern.
What about and year rally
ReplyDeleteWhat about end year rally? Who says there should be such?
DeleteSanta wears red
DeleteKrasi, i thought you will stop replying to Lady S :-)
DeleteWhy not answer me? I am not the only one that react, and I am not so far from krasi that sign 3700
ReplyDeleteI think this is 20d low and the first week of December will be 40w high
ReplyDeleteThis is way too long for high-to-high cycle.
DeleteWhat do you think about divergence building up on UVXY, Krasi? A bit odd to see that when it feels like market is gaining strength for a move higher.
ReplyDeleteThere is no UVXY divergence it will happen latter probably when the market is making the final high.
DeleteI think it was a bull trap today vix looks depressed
ReplyDeleteI thin the pullback is not finished and it will continue next week.
DeletePullback to 3400?
ReplyDeleteI would say max 50% to 3450.
DeleteKrasi you don't see the S&P 500 lower than 3450 short term?
ReplyDeleteThe VIX is at multi month support
And the % of S&P 500 stocks above the 50 DMA is at an extreme number.
http://schrts.co/QZfFmSVs VIX support
http://schrts.co/MDAQkxTJ S&P 500 stocks above 50 DMA
All of this at least in the short term seems very overbought
No, 62% or more retracement is not very likely. It will mean reversal or another sideways pattern.
DeleteWhat do you think about Ibex?
ReplyDeleteThe same like all other indices - corrective retracement higher.
Delete