Trading cycle - buy signal. I have changed the counts, as I have explained last week they do not make sense any more. The low-to-low count one longer and one shorter daily cycle with average 2x45 days which is the usual average and this is in sync with the cycle model - 4 daily cycles for one 40w cycle.
The high-to-high count is way too long so with high probability we have two daily cycles from the high in September. The second one needs something like two weeks for a high which is in sync with the cycle model too.
The perfect outcome will be a few days lower for half cycle low and push higher to complete high-to-high daily cycle.

TECHNICAL PICTURE and ELLIOTT WAVES
Short term - either b is completed as a triangle and c running or one more leg lower to complete b as a flat. It is difficult to say... if you look at other indices like NYSE/RUT the first option looks better, when I look at cycles the second option looks better.

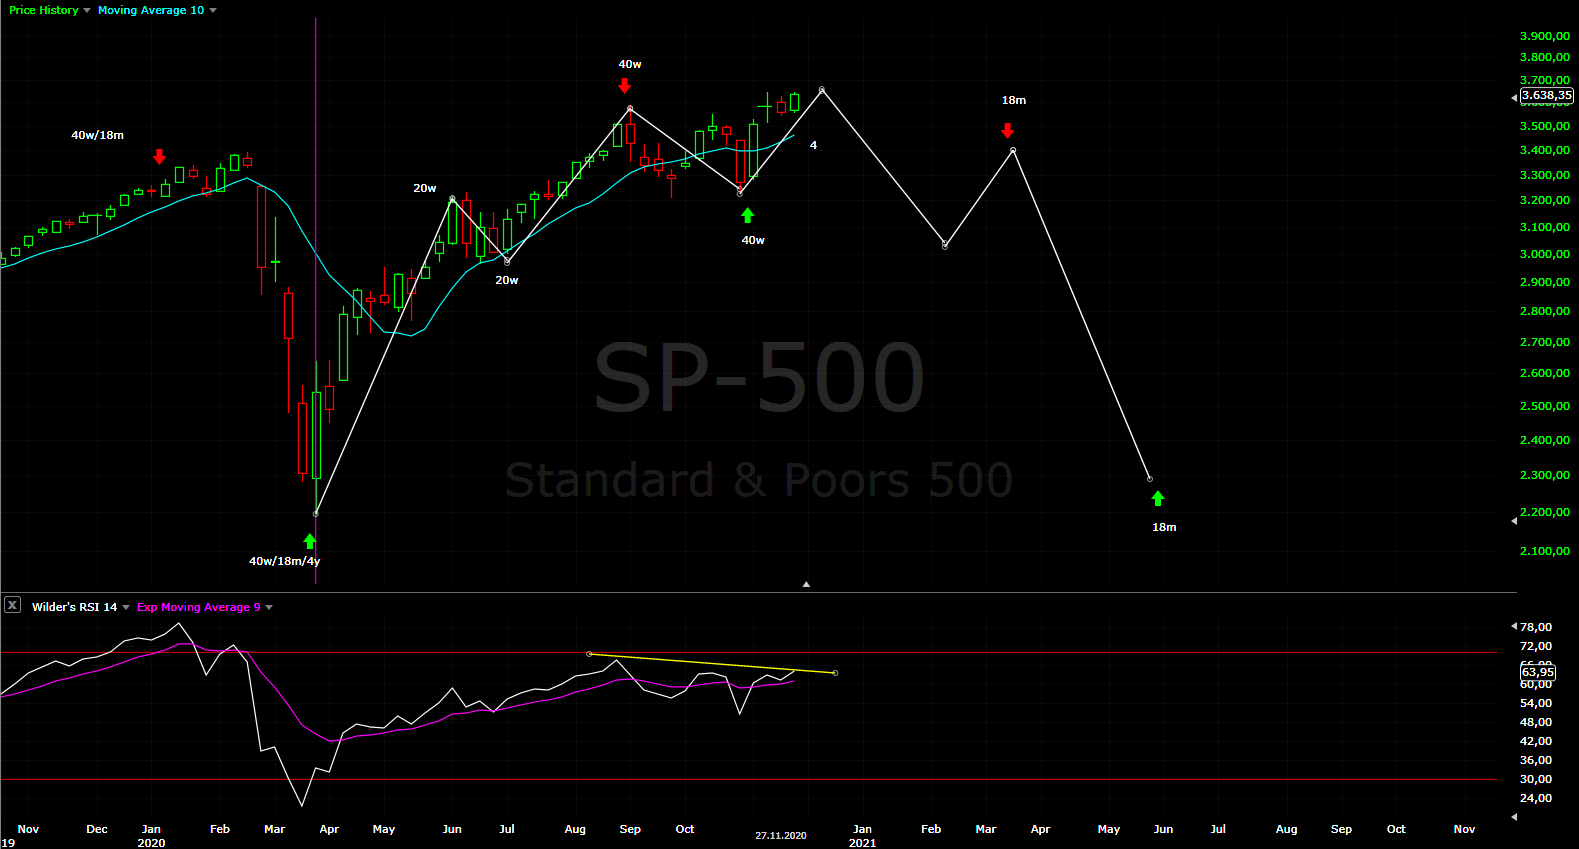
Intermediate term - nothing new. The indicators with divergences warning for a high. The pattern which fits best is symmetrical completing at 18m high. Alternate the pattern completes at the current high g/Z. The difference will be the speed of the decline, which will follow.

Long term - the bull market completed in 2018. Since then a bunch of corrective waves. Currently I think this rally should be a corrective wave of a bigger pattern most likely triangle. Look at NDX we have corrective wave which is 1,618 bigger than the previous one which could be only b of a triangle. I think the best looking pattern is Neely's triangle. The indices are close to price high and turn lower. The indicators are pointing to topping not continuation. The weekly candles telling the same no continuation after the big green candle.

MARKET BREADTH INDICATORS
Market Breadth Indicators - do not follow higher. I think they are preparing for short term divergences, we have long term divergences already. In the mean time there is a lot of euphoria Fear&Greed reached 92.
McClellan Oscillator - pullback from the high.
McClellan Summation Index - buy signal.
Weekly Stochastic of the Summation Index - buy signal.
Bullish Percentage - pullback from the high.
Percent of Stocks above MA50 - pullback from the high.
Fear Indicator VIX - testing the previous low.
Advance-Decline Issues - pullback from the high.
HURST CYCLES
Short term cycles - we have 20d low either at day 9 or 15 and now hitting 20d high next should be 20d/5w low.

Week 4 for the 20w cycle. This is the cycle model I have shown last week. It makes most sense and I will follow this one until I see it is wrong.
Please Krasi what Is your view on Oil?
ReplyDeleteThe same like the indices I can not say anything different - it is corrective we saw 40w high and 40w low now the second part of the corrective move up is running.
DeleteFinal target around 30?
DeleteIt is way too early to make some projections.
DeleteThank you I'm wondering if a mid east war would start the wave C for the markets and send oil to it's next wave 3. I don't think anyone is expecting a war even now after the scientist assassination. The black swan may yet again return
ReplyDeleteid be more worried about electoral college.. they may vote trump in.. anger dems/blm/antifa and again mass demonstrations.. with another 4 years of "trump isnt legitimate" president..
DeleteGracias. Acabo de conocer su blog. Que significa 5w o 10w
ReplyDeletew is short for week. 5w means "5 week cycle" and so on for 10w/20w/40w.
DeleteBack around 9/1 I posted some momentum charts here. These were the originals - https://imgur.com/a/PzbmDJI
ReplyDeleteHere are some updated ones - https://imgur.com/a/477bIir
It's a good lesson in how drawing trendlines is more of an art than a science. I was a little aggressive with the slope of my lines for SPX and IWM back on 9/1, so they caught the short-term top, but not the entire move from the March low. Now that I've re-drawn them to include the June lows it shows a better picture of what I believe is the entire move from the March low, which appears ready to terminate imminently.
My original chart for SLV (a proxy for gold and GDX/GDXJ as well) proved to be accurate and by now there is a clean down-trend path in play pointing towards next spring.
Most assets are showing a similar pattern close to exhaustion, whether it's BTC, junk bonds, copper, oil, FAANG, etc. The only two asset classes that stand out as having the potential to bottom and rally are treasuries and the dollar.
I'll just add that I've noticed an excessive amount of bullishness (in my opinion) towards metals and miners in the last few weeks. It's coming from Wall St. professional analysts as well as the usual fintwit accounts who all believe the fantasy that the "money" the Fed has been "printing" (bank reserves, in reality) is real and inflationary. Hate to break it to them, but...
ReplyDeleteUp until this past week there were attempts to view the price action over the last couple months in gold and GDX as a giant bull flag forming. I think that theory is now blown, but people still don't seem to have any sense that metals can keep falling for several months, possibly even turning into a crash if liquidity in credit and repo markets tightens like it did in March.
So the point being that anyone expecting these things to "hedge" against equity risk might find a repeat of March where they end up performing as bad (or worse) as the asset they are intending to hedge. Be careful.
Are you saying gold may have topped? Sacrilege! Haha Lara Irate on YouTube has been the only analyst I know warning this. Her ew analysis is quite convincing for gold. Shes also seeing a C down for the markets coming very soon as an alternate count.
DeleteHer primary Gold count looks to be in danger. She also sees Krasi's scenario is being a very low probability alternative, and thinks S&P will go to 4000+ instead. Time will tell I guess!
DeleteLara Irate is typical example what happened last year and what is going on now with forecasting - 99% of so called "EW experts" with decades experience and paid subscriptions can not make a difference between impulse and corrective wave..... stunning incompetence.
DeleteHonestly I am shocked how clueless are all this guys. Instead of learning the lesson from last year they are doing the same again and they all will look like fools again.
Thanks for mentioning her, I'd never heard of her before. Interesting counts, but I'm obviously biased towards her alt count for SPX with the C down haha!
ReplyDeleteI'm curious why she likes advance-decline so much as a TA indicator. I've seen other people refer to this a lot (like xTrends on Twitter) as a signal, but in my experience it is terrible in practice for spotting tops.
Compare NYAD here to a much better top spotter like %B - https://i.imgur.com/lbxNBXN.png
Every major top in the last 3 years showed a divergence on %B where the final high couldn't get above 1.0 (meaning the top bollinger band). A lot of the time couldn't even get above 0.8-0.9, which is what just happened with the last move.
Meanwhile the NYAD line only showed a minor divergence on 1 of the last 7 highs if you try to use it that way. I think the way Krasi uses NYAD is much better, where you draw trendlines on the 10 day MA of it. Then it becomes a confirming signal that we are very close to a high - https://i.imgur.com/SJRk1V8.png
Actually to be fair NYAD did show a minor divergence at the Sept 2nd peak we just had that %B missed. IMO it's more important to see how these things act at MAJOR highs like Jan 18, Oct 18, Feb 20 and right now.
DeleteVery nice, going to add that %B to my arsenal as I have come to really appreciate BBs in general for swing trading. Thank you
DeleteBB has been working for me as sell lately.. credit to ElliotTrader who got me into it...
Deletehow do i track or look up %B?
DeleteThank you
that should be top
ReplyDeleteNever mind. Doesn't look impulsive could still be in 4
DeleteRussell looking impulsive today tho
DeletePossible triangle for the b wave and 20d low at day 11 - https://invst.ly/s-k8v
ReplyDeleteWe will know tomorrow....
Nice catch. Impulse overnight starts C it seems
DeleteOr the mess continues like this - https://invst.ly/s-o14
DeleteThis will allow NYSE/SPX/DJI to have the same pattern.
Krasi do you think tlt is about to drop hard?
ReplyDeleteI do not know the pattern I guess at least the same size like the decline in March, but it will take time the cycles look similar so it will last until spring for the drop.
Deletelook at the weekly chart of tyx...and pls let me know if you still have the same opinion.
ReplyDeleteThanks.
I've been curious about what rates at the long end will do in the coming months. On the weekly, it does appear they are in an uptrend that has room to go - https://imgur.com/a/xtn8PZy
DeleteAt the same time look at the black rectangles. Over the last half year 30-yr rates have gone nowhere. Maybe the trend continues for a few more months (no guarantee of that) and we get one emotional spike up in yields before the market truly accepts the deflation we are headed into?
More interesting is the relationship between TLT/SPY - https://i.imgur.com/meNZuvt.png
Even if treasuries keep falling for awhile longer, I am very certain that we are about at the point where stocks start falling faster and TLT will start to outperform SPY again.
It would be very surprising to a lot of large funds and pensions is stocks and bonds both fall in tandem over the next 3-4 months, along with gold, oil and other commodities. How much passive income is currently hedged with something alternative like long volatility? In a severe collateral shortage I would at least expect the dollar and the very short end of the curve (bills out to 3-yr paper) to perform well.
It is the same, but inverted.
DeleteThe game is repeating there is a shock the USD goes up everything else down - everybody needs cash gold bonds bitcoin safe havens does not matter.
Just for fun another possible NEoWave pattern from Neely's 10/15 video where he looked at three possible patterns for the B wave. I think by now the diametric is ruled out, and I posted his Triple ZigZag here the other week.
ReplyDeleteOther than symmetrical, the other option was Contracting Triangle - https://i.imgur.com/FieCn0t.png
I don't know all the rules, but it looks a lot like what he projected - https://i.imgur.com/4xTBoRX.png
I remember in the video he said it was the preferred pattern on the monthly chart b/c it was the most boring and took the longest.
The triangle looks exactly the same, but it is suspicious because e is too vertical and strong...
DeleteWe can only wait and see the speed of the next move lower. In the case of completed pattern especially triangle the price should move very fast lower.
Yesterday/Last night looks like a wave 1, today, finishing abc. Hasn't looked that clear in weeks. Guess we'll see soon
ReplyDeleteI doubt there is impulses....
DeleteWell vix is slightly awake today, at least
DeleteNew ATH
ReplyDeleteAnd what does it mean?
Deleteending diagonal still up against long term trendline resistance . Must be time for it to jump that on way to 3800 or rollover . How many more days ....
ReplyDeleteAnother week according to the short term cycles.
DeleteThe pattern looks like we had the blow off now it is just topping so expect roll over.
It means the movement down wasn't impuls
ReplyDeleteBang zoom Alice!
ReplyDeleteYour showing your age Roberto
DeleteHighly recommend the mooners to cheer me up after this week
DeleteThe eur-usd is now 40w and 18 month high?
ReplyDeleteI think so.
DeleteSo we have to see one more week from the cycles?
ReplyDeleteYes
Deletetlt breaking? TYX weekly impulse move(break out)? Any thoughts?
ReplyDeleteI do not see anything special happening....
Deletelooked like an ending diagonal complete very soon
ReplyDeleteNot very likely - you have to count expanding ED very rare if it exists at all or w1(3 longer than 1) of ED and weeks before it is completed.
DeleteIt looks like its just heading to the moon. Ive been following this blog for quite some time and Ive found it informative. Whats going on now though just seems irrational to me. I have felt for some time now there there was a drop coming. But it never materialized.
ReplyDeleteThe markets are always irrational because they are driven by emotions.
DeleteForget about feelings and reason and learn how to measure emotions - pattern and cycles.
They are doing good job showing clearly that the move is not complete no matter how irrational it looks like.